고정 헤더 영역
상세 컨텐츠
본문
| 본 글은 CloudNet@ 팀 가시다님의 'AWS EKS Hands-on' 스터디를 내용을 기반으로 정리하였습니다. Kubernetes(이하 k8s)에 대한 지식(아키텍처, 사용법 등)이 있다고 가정하고 작성했습니다. 잘못된 정보가 있으면 언제든지 알려주시기 바랍니다. |
목차
| 0. 실습 환경 배포 1. HPA - Horizontal Pod Autoscaler 2. KEDA - Kubernetes based Event Driven Autoscaler 3. VPA - Vertical Pod Autoscaler 4. CAS - Cluster Autoscaler 5. CPA - Cluster Proportional Autoscaler 6. Karpenter |
0. 실습 환경 배포 & 소개
- 이론

1. Auto Scaling 개념
| . 수평 확장 (Horizontal Scaling) | 여러 워크로드(VM, Task, Pod) 추가하여 트래픽 분산 |
| . 수직 확장 (Vertical Scaling) | 기존 워크로드의 CPU, 메모리 자원을 향상 (유연성 ↓, 장애 위험 ↑) |
2. AWS Auto Scaling 정책
| . Simple/Step Scaling | 정의된 단계별 메트릭을 모니터링 후 인스턴스 추가/제거 |
| . Target Tracking | 목표 메트릭 유지 위해 자동으로 인스턴스 조정 |
| . Scheduled Scaling | 특정 일정에 맞춰 인스턴스를 시작/종료 |
| . Predictive Scaling | 과거 트렌드 기반 선제적 용량 확장 |
3. Kubernetes Auto Scaling 정책
- 확장 방법 : 노드 vs 컨테이너

| . 컨테이너 수평 확장 (HPA) | CPU, 메모리 사용량 기반으로 파드 추가/제거 |
| . 컨테이너 수직 확장 (VPA) | 파드 교체를 통해 CPU, 메모리 자원 증가 |
| . 노드 수평 확장 (Cluster Autoscaler) | Pending 파드 발생 시 신규 노드 추가 |
| . 노드 수직 확장 | 기존 노드의 CPU, 메모리 증가 |
- 확장 기준

| . 리소스 메트릭 기반 | CPU, 메모리 사용량으로 확장 결정 |
| . 애플리케이션 메트릭 기반 | 내부 지표(예: 요청 수, 응답 시간) 활용 |
| . 이벤트 기반 | 일정, 대기열 등 특정 이벤트 발생 시 확장 |
- 확장 정책
| . 단순 확장 | 기본적인 확장 방식 |
| . 단계 확장 | 정해진 단계별 확장 |
| . 목표 추적 확장 | 목표 메트릭 유지 위해 자동 조정 |
4. EKS Auto Scaling
| . HPA (Horizontal Pod Autoscaler) | 파드 리소스 부족 시 Scale Out |
| . VPA (Vertical Pod Autoscaler) | 파드 리소스 부족 시 Scale Up |
| . CAS (Cluster Autoscaler) | 노드 부족 시 Scale Out |
| . Karpenter | Unscheduled 파드 감지 후 노드 자동 생성 |
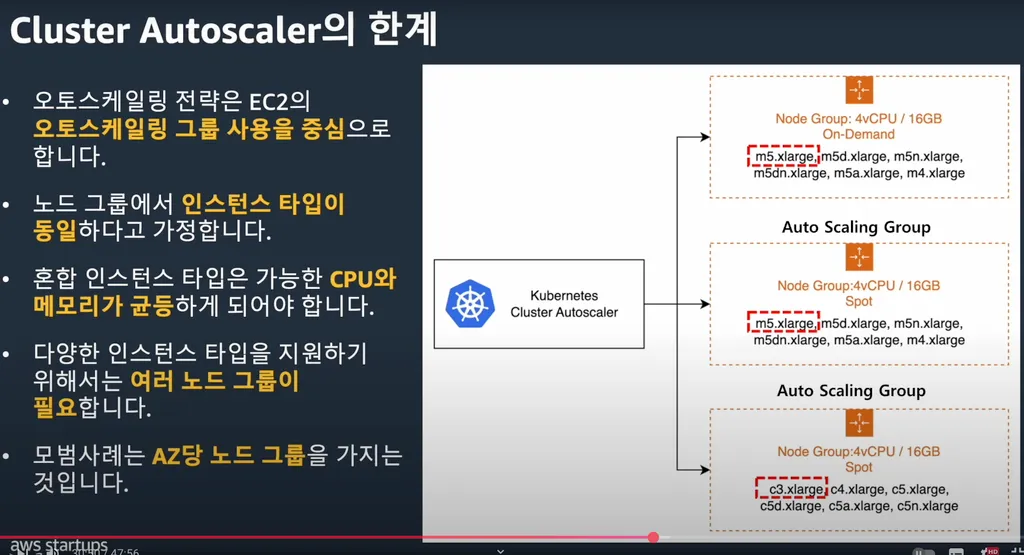
> Auto Scaling 한계
5. Karpenter (EKS 노드 프로비저닝)
. 유연한 노드 프로비저닝
. 빠른 스케일링
. 비용 최적화
. EC2와 통합
. Over Provisioning 지원

7. Custom Metric 활용
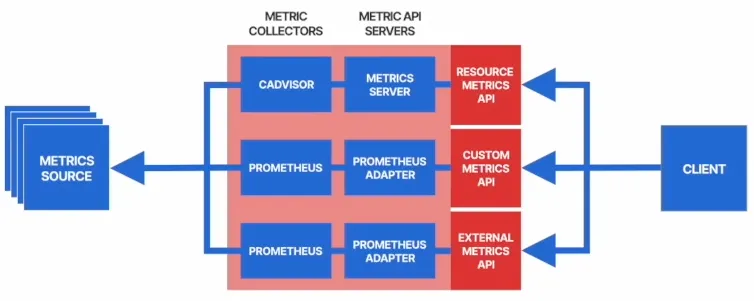
| . Resource Metric API | CPU, 메모리 사용량 기반 파드 확장 (metrics.k8s.io) |
| . Custom Metric API | 사용자 정의 메트릭 기반 확장 (custom.metrics.k8s.io) |
| . External Metric API | 클러스터 외부 지표 기반 확장 (external.metrics.k8s.io) |
8. KEDA (Event 기반 Auto Scaling)
| . 이벤트 기반 Auto Scaling | HPA를 활용한 다양한 트리거 지원 |
| . Cron, 메시지 큐 트리거 | 특정 시간대 스케일링 가능 |
| . Karpenter 통합 가능 | 클러스터 수준 오토스케일링 지원 |
- Amazon EKS (myeks) 윈클릭 배포 & 기본 설정
. Amazon EKS (myeks) 윈클릭 배포
# YAML 파일 다운로드
curl -O https://s3.ap-northeast-2.amazonaws.com/cloudformation.cloudneta.net/K8S/myeks-5week.yaml

# 변수 지정
CLUSTER_NAME=myeks
SSHKEYNAME=<SSH 키 페이 이름>
MYACCESSKEY=<IAM Uesr 액세스 키>
MYSECRETKEY=<IAM Uesr 시크릿 키>

# CloudFormation 스택 배포
aws cloudformation deploy --template-file myeks-5week.yaml --stack-name $CLUSTER_NAME --parameter-overrides KeyName=$SSHKEYNAME SgIngressSshCidr=$(curl -s ipinfo.io/ip)/32  MyIamUserAccessKeyID=$MYACCESSKEY MyIamUserSecretAccessKey=$MYSECRETKEY ClusterBaseName=$CLUSTER_NAME --region ap-northeast-2

# CloudFormation 스택 배포 완료 후 작업용 EC2 IP 출력
aws cloudformation describe-stacks --stack-name myeks --query 'Stacks[*].Outputs[0].OutputValue' --output text
. 자신의 PC에서 AWS EKS 설치 확인 - eks 생성 후 수행
# 변수 지정
CLUSTER_NAME=myeks
SSHKEYNAME=kp-gasida

#
eksctl get cluster

# kubeconfig 생성
aws sts get-caller-identity --query Arn
aws eks update-kubeconfig --name myeks --user-alias <위 출력된 자격증명 사용자>
aws eks update-kubeconfig --name myeks --user-alias admin

#
kubectl ns default
kubectl get node --label-columns=node.kubernetes.io/instance-type,eks.amazonaws.com/capacityType,topology.kubernetes.io/zone
kubectl get pod -A
kubectl get pdb -n kube-system
. 노드 IP 정보 확인 및 SSH 접속
# EC2 공인 IP 변수 지정
export N1=$(aws ec2 describe-instances --filters "Name=tag:Name,Values=myeks-ng1-Node" "Name=availability-zone,Values=ap-northeast-2a" --query 'Reservations[*].Instances[*].PublicIpAddress' --output text)
export N2=$(aws ec2 describe-instances --filters "Name=tag:Name,Values=myeks-ng1-Node" "Name=availability-zone,Values=ap-northeast-2b" --query 'Reservations[*].Instances[*].PublicIpAddress' --output text)
export N3=$(aws ec2 describe-instances --filters "Name=tag:Name,Values=myeks-ng1-Node" "Name=availability-zone,Values=ap-northeast-2c" --query 'Reservations[*].Instances[*].PublicIpAddress' --output text)
echo $N1, $N2, $N3

# *remoteAccess* 포함된 보안그룹 ID
aws ec2 describe-security-groups --filters "Name=group-name,Values=*remoteAccess*" | jq
export MNSGID=$(aws ec2 describe-security-groups --filters "Name=group-name,Values=*remoteAccess*" --query 'SecurityGroups[*].GroupId' --output text)

# 해당 보안그룹 inbound 에 자신의 집 공인 IP 룰 추가
aws ec2 authorize-security-group-ingress --group-id $MNSGID --protocol '-1' --cidr $(curl -s ipinfo.io/ip)/32

# 해당 보안그룹 inbound 에 운영서버 내부 IP 룰 추가
aws ec2 authorize-security-group-ingress --group-id $MNSGID --protocol '-1' --cidr 172.20.1.100/32

# 워커 노드 SSH 접속
for i in $N1 $N2 $N3; do echo ">> node $i <<"; ssh -o StrictHostKeyChecking=no ec2-user@$i hostname; echo; done
. 운영서버 EC2 에 SSH 접속 (SSH 키 파일 사용) : AWS EKS 설치 확인
# default 네임스페이스 적용
kubectl ns default

# 환경변수 정보 확인
export | egrep 'ACCOUNT|AWS_|CLUSTER|KUBERNETES|VPC|Subnet'
export | egrep 'ACCOUNT|AWS_|CLUSTER|KUBERNETES|VPC|Subnet' | egrep -v 'KEY'

# krew 플러그인 확인
kubectl krew list

# 인스턴스 정보 확인
aws ec2 describe-instances --query "Reservations[*].Instances[*].{InstanceID:InstanceId, PublicIPAdd:PublicIpAddress, PrivateIPAdd:PrivateIpAddress, InstanceName:Tags[?Key=='Name']|[0].Value, Status:State.Name}" --filters Name=instance-state-name,Values=running --output table

# 노드 IP 확인 및 PrivateIP 변수 지정
aws ec2 describe-instances --query "Reservations[*].Instances[*].{PublicIPAdd:PublicIpAddress,PrivateIPAdd:PrivateIpAddress,InstanceName:Tags[?Key=='Name']|[0].Value,Status:State.Name}" --filters Name=instance-state-name,Values=running --output table
N1=$(kubectl get node --label-columns=topology.kubernetes.io/zone --selector=topology.kubernetes.io/zone=ap-northeast-2a -o jsonpath={.items[0].status.addresses[0].address})
N2=$(kubectl get node --label-columns=topology.kubernetes.io/zone --selector=topology.kubernetes.io/zone=ap-northeast-2b -o jsonpath={.items[0].status.addresses[0].address})
N3=$(kubectl get node --label-columns=topology.kubernetes.io/zone --selector=topology.kubernetes.io/zone=ap-northeast-2c -o jsonpath={.items[0].status.addresses[0].address})
echo "export N1=$N1" >> /etc/profile
echo "export N2=$N2" >> /etc/profile
echo "export N3=$N3" >> /etc/profile
echo $N1, $N2, $N3

# 노드 IP 로 ping 테스트
for i in $N1 $N2 $N3; do echo ">> node $i <<"; ping -c 1 $i ; echo; done
. 실습 편의를 위한 변수 지정
export CLUSTER_NAME=myeks
export VPCID=$(aws ec2 describe-vpcs --filters "Name=tag:Name,Values=$CLUSTER_NAME-VPC" --query 'Vpcs[*].VpcId' --output text)
export PubSubnet1=$(aws ec2 describe-subnets --filters Name=tag:Name,Values="$CLUSTER_NAME-Vpc1PublicSubnet1" --query "Subnets[0].[SubnetId]" --output text)
export PubSubnet2=$(aws ec2 describe-subnets --filters Name=tag:Name,Values="$CLUSTER_NAME-Vpc1PublicSubnet2" --query "Subnets[0].[SubnetId]" --output text)
export PubSubnet3=$(aws ec2 describe-subnets --filters Name=tag:Name,Values="$CLUSTER_NAME-Vpc1PublicSubnet3" --query "Subnets[0].[SubnetId]" --output text)
export N1=$(aws ec2 describe-instances --filters "Name=tag:Name,Values=$CLUSTER_NAME-ng1-Node" "Name=availability-zone,Values=ap-northeast-2a" --query 'Reservations[*].Instances[*].PublicIpAddress' --output text)
export N2=$(aws ec2 describe-instances --filters "Name=tag:Name,Values=$CLUSTER_NAME-ng1-Node" "Name=availability-zone,Values=ap-northeast-2b" --query 'Reservations[*].Instances[*].PublicIpAddress' --output text)
export N3=$(aws ec2 describe-instances --filters "Name=tag:Name,Values=$CLUSTER_NAME-ng1-Node" "Name=availability-zone,Values=ap-northeast-2c" --query 'Reservations[*].Instances[*].PublicIpAddress' --output text)
export CERT_ARN=$(aws acm list-certificates --query 'CertificateSummaryList[].CertificateArn[]' --output text) #사용 리전의 인증서 ARN 확인
MyDomain=gasida.link # 각자 자신의 도메인 이름 입력
MyDnzHostedZoneId=$(aws route53 list-hosted-zones-by-name --dns-name "$MyDomain." --query "HostedZones[0].Id" --output text)
. AWS LoadBalancer Controller, ExternalDNS, gp3 storageclass, kube-ops-view(Ingress) 설치
<설치>
# AWS LoadBalancerController
helm repo add eks https://aws.github.io/eks-charts
helm install aws-load-balancer-controller eks/aws-load-balancer-controller -n kube-system --set clusterName=$CLUSTER_NAME \
  --set serviceAccount.create=false --set serviceAccount.name=aws-load-balancer-controller

# ExternalDNS
echo $MyDomain
curl -s https://raw.githubusercontent.com/gasida/PKOS/main/aews/externaldns.yaml | MyDomain=$MyDomain MyDnzHostedZoneId=$MyDnzHostedZoneId envsubst | kubectl apply -f -

# gp3 스토리지 클래스 생성
cat <<EOF | kubectl apply -f -
kind: StorageClass
apiVersion: storage.k8s.io/v1
metadata:
  name: gp3
  annotations:
    storageclass.kubernetes.io/is-default-class: "true"
allowVolumeExpansion: true
provisioner: ebs.csi.aws.com
volumeBindingMode: WaitForFirstConsumer
parameters:
  type: gp3
  allowAutoIOPSPerGBIncrease: 'true'
  encrypted: 'true'
  fsType: xfs # 기본값이 ext4
EOF
kubectl get sc


# kube-ops-view
helm repo add geek-cookbook https://geek-cookbook.github.io/charts/
helm install kube-ops-view geek-cookbook/kube-ops-view --version 1.2.2 --set service.main.type=ClusterIP  --set env.TZ="Asia/Seoul" --namespace kube-system

# kubeopsview 용 Ingress 설정 : group 설정으로 1대의 ALB를 여러개의 ingress 에서 공용 사용
echo $CERT_ARN
cat <<EOF | kubectl apply -f -
apiVersion: networking.k8s.io/v1
kind: Ingress
metadata:
  annotations:
    alb.ingress.kubernetes.io/certificate-arn: $CERT_ARN
    alb.ingress.kubernetes.io/group.name: study
    alb.ingress.kubernetes.io/listen-ports: '[{"HTTPS":443}, {"HTTP":80}]'
    alb.ingress.kubernetes.io/load-balancer-name: $CLUSTER_NAME-ingress-alb
    alb.ingress.kubernetes.io/scheme: internet-facing
    alb.ingress.kubernetes.io/ssl-redirect: "443"
    alb.ingress.kubernetes.io/success-codes: 200-399
    alb.ingress.kubernetes.io/target-type: ip
  labels:
    app.kubernetes.io/name: kubeopsview
  name: kubeopsview
  namespace: kube-system
spec:
  ingressClassName: alb
  rules:
  - host: kubeopsview.$MyDomain
    http:
      paths:
      - backend:
          service:
            name: kube-ops-view
            port:
              number: 8080  # name: http
        path: /
        pathType: Prefix
EOF

<확인>
# 설치된 파드 정보 확인
kubectl get pods -n kube-system

# service, ep, ingress 확인
kubectl get ingress,svc,ep -n kube-system

# Kube Ops View 접속 정보 확인 : 조금 오래 기다리면 접속됨...
echo -e "Kube Ops View URL = https://kubeopsview.$MyDomain/#scale=1.5"
open "https://kubeopsview.$MyDomain/#scale=1.5" # macOS
. Prometheus, Grafana(admin / prom-operator) 설치 : 대시보드 import 17900 (메트릭 N/A로 보일시 PromQl, Variables 수정 필요 - 4주차 post 확인)
# repo 추가
helm repo add prometheus-community https://prometheus-community.github.io/helm-charts

# 파라미터 파일 생성 : PV/PVC(AWS EBS) 삭제에 불편하니, 4주차 실습과 다르게 PV/PVC 미사용
cat <<EOT > monitor-values.yaml
prometheus:
  prometheusSpec:
    scrapeInterval: "15s"
    evaluationInterval: "15s"
    podMonitorSelectorNilUsesHelmValues: false
    serviceMonitorSelectorNilUsesHelmValues: false
    retention: 5d
    retentionSize: "10GiB"

  # Enable vertical pod autoscaler support for prometheus-operator
  verticalPodAutoscaler:
    enabled: true

  ingress:
    enabled: true
    ingressClassName: alb
    hosts:
      - prometheus.$MyDomain
    paths:
      - /*
    annotations:
      alb.ingress.kubernetes.io/scheme: internet-facing
      alb.ingress.kubernetes.io/target-type: ip
      alb.ingress.kubernetes.io/listen-ports: '[{"HTTPS":443}, {"HTTP":80}]'
      alb.ingress.kubernetes.io/certificate-arn: $CERT_ARN
      alb.ingress.kubernetes.io/success-codes: 200-399
      alb.ingress.kubernetes.io/load-balancer-name: myeks-ingress-alb
      alb.ingress.kubernetes.io/group.name: study
      alb.ingress.kubernetes.io/ssl-redirect: '443'

grafana:
  defaultDashboardsTimezone: Asia/Seoul
  adminPassword: prom-operator
  defaultDashboardsEnabled: false

  ingress:
    enabled: true
    ingressClassName: alb
    hosts:
      - grafana.$MyDomain
    paths:
      - /*
    annotations:
      alb.ingress.kubernetes.io/scheme: internet-facing
      alb.ingress.kubernetes.io/target-type: ip
      alb.ingress.kubernetes.io/listen-ports: '[{"HTTPS":443}, {"HTTP":80}]'
      alb.ingress.kubernetes.io/certificate-arn: $CERT_ARN
      alb.ingress.kubernetes.io/success-codes: 200-399
      alb.ingress.kubernetes.io/load-balancer-name: myeks-ingress-alb
      alb.ingress.kubernetes.io/group.name: study
      alb.ingress.kubernetes.io/ssl-redirect: '443'

kube-state-metrics:
  rbac:
    extraRules:
      - apiGroups: ["autoscaling.k8s.io"]
        resources: ["verticalpodautoscalers"]
        verbs: ["list", "watch"]
  customResourceState:
    enabled: true
    config:
      kind: CustomResourceStateMetrics
      spec:
        resources:
          - groupVersionKind:
              group: autoscaling.k8s.io
              kind: "VerticalPodAutoscaler"
              version: "v1"
            labelsFromPath:
              verticalpodautoscaler: [metadata, name]
              namespace: [metadata, namespace]
              target_api_version: [apiVersion]
              target_kind: [spec, targetRef, kind]
              target_name: [spec, targetRef, name]
            metrics:
              - name: "vpa_containerrecommendations_target"
                help: "VPA container recommendations for memory."
                each:
                  type: Gauge
                  gauge:
                    path: [status, recommendation, containerRecommendations]
                    valueFrom: [target, memory]
                    labelsFromPath:
                      container: [containerName]
                commonLabels:
                  resource: "memory"
                  unit: "byte"
              - name: "vpa_containerrecommendations_target"
                help: "VPA container recommendations for cpu."
                each:
                  type: Gauge
                  gauge:
                    path: [status, recommendation, containerRecommendations]
                    valueFrom: [target, cpu]
                    labelsFromPath:
                      container: [containerName]
                commonLabels:
                  resource: "cpu"
                  unit: "core"
  selfMonitor:
    enabled: true

alertmanager:
  enabled: false
defaultRules:
  create: false
kubeControllerManager:
  enabled: false
kubeEtcd:
  enabled: false
kubeScheduler:
  enabled: false
prometheus-windows-exporter:
  prometheus:
    monitor:
      enabled: false
EOT
cat monitor-values.yaml

# helm 배포
helm install kube-prometheus-stack prometheus-community/kube-prometheus-stack --version 69.3.1 \
-f monitor-values.yaml --create-namespace --namespace monitoring

# helm 확인
helm get values -n monitoring kube-prometheus-stack

# PV 사용하지 않음
kubectl get pv,pvc -A
kubectl df-pv

# 프로메테우스 웹 접속
echo -e "https://prometheus.$MyDomain"
open "https://prometheus.$MyDomain" # macOS

# 그라파나 웹 접속 : admin / prom-operator
echo -e "https://grafana.$MyDomain"
open "https://grafana.$MyDomain" # macOS

#
kubectl get targetgroupbindings.elbv2.k8s.aws -A


# 상세 확인
kubectl get pod -n monitoring -l app.kubernetes.io/name=kube-state-metrics
kubectl describe pod -n monitoring -l app.kubernetes.io/name=kube-state-metrics
...
Service Account:  kube-prometheus-stack-kube-state-metrics
...
    Args:
      --port=8080
      --resources=certificatesigningrequests,configmaps,cronjobs,daemonsets,deployments,endpoints,horizontalpodautoscalers,ingresses,jobs,leases,limitranges,mutatingwebhookconfigurations,namespaces,networkpolicies,nodes,persistentvolumeclaims,persistentvolumes,poddisruptionbudgets,pods,replicasets,replicationcontrollers,resourcequotas,secrets,services,statefulsets,storageclasses,validatingwebhookconfigurations,volumeattachments
      --custom-resource-state-config-file=/etc/customresourcestate/config.yaml
    ...
Volumes:
  customresourcestate-config:
    Type:      ConfigMap (a volume populated by a ConfigMap)
    Name:      kube-prometheus-stack-kube-state-metrics-customresourcestate-config
    Optional:  false
...

kubectl describe cm -n monitoring kube-prometheus-stack-kube-state-metrics-customresourcestate-config
...

#
kubectl get clusterrole kube-prometheus-stack-kube-state-metrics
kubectl describe clusterrole kube-prometheus-stack-kube-state-metrics
kubectl describe clusterrole kube-prometheus-stack-kube-state-metrics | grep verticalpodautoscalers
  verticalpodautoscalers.autoscaling.k8s.io                     []                 []              [list watch]
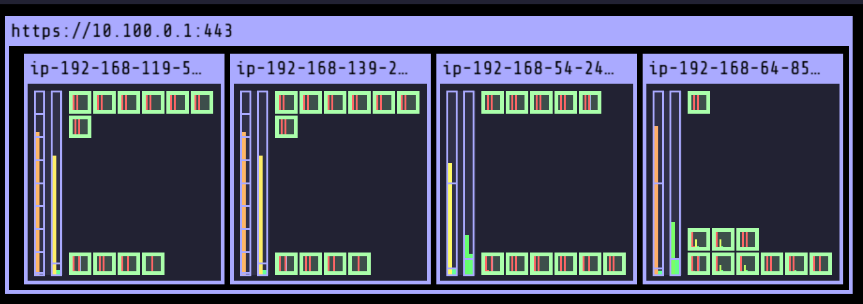
. EKS Node Viewer : 노드 할당 가능 용량 및 request 표시
- Node마다 할당 가능한 용량, Pod의 request 표시
> 설치
# macOS 설치
brew tap aws/tap
brew install eks-node-viewer

# 운영서버 EC2에 설치 : userdata 통해 이미 설치 되어 있음
yum install golang -y
go install github.com/awslabs/eks-node-viewer/cmd/eks-node-viewer@latest  # 설치 시 2~3분 정도 소요

# Windows 에 WSL2 (Ubuntu) 설치
sudo apt install golang-go
go install github.com/awslabs/eks-node-viewer/cmd/eks-node-viewer@latest  # 설치 시 2~3분 정도 소요
echo 'export PATH="$PATH:/root/go/bin"' >> /etc/profile
> 사용
# Standard usage
eks-node-viewer

# Display both CPU and Memory Usage
eks-node-viewer --resources cpu,memory
eks-node-viewer --resources cpu,memory --extra-labels eks-node-viewer/node-age

# Display extra labels, i.e. AZ : node 에 labels 사용 가능
eks-node-viewer --extra-labels topology.kubernetes.io/zone
eks-node-viewer --extra-labels kubernetes.io/arch

# Sort by CPU usage in descending order
eks-node-viewer --node-sort=eks-node-viewer/node-cpu-usage=dsc

# Karenter nodes only
eks-node-viewer --node-selector "karpenter.sh/provisioner-name"

# Specify a particular AWS profile and region
AWS_PROFILE=myprofile AWS_REGION=us-west-2


Computed Labels : --extra-labels
# eks-node-viewer/node-age - Age of the node
eks-node-viewer --extra-labels eks-node-viewer/node-age
eks-node-viewer --extra-labels topology.kubernetes.io/zone,eks-node-viewer/node-age

# eks-node-viewer/node-ephemeral-storage-usage - Ephemeral Storage usage (requests)
eks-node-viewer --extra-labels eks-node-viewer/node-ephemeral-storage-usage

# eks-node-viewer/node-cpu-usage - CPU usage (requests)
eks-node-viewer --extra-labels eks-node-viewer/node-cpu-usage

# eks-node-viewer/node-memory-usage - Memory usage (requests)
eks-node-viewer --extra-labels eks-node-viewer/node-memory-usage

# eks-node-viewer/node-pods-usage - Pod usage (requests)
eks-node-viewer --extra-labels eks-node-viewer/node-pods-usage
1. HPA - Horizontal Pod Autoscaler
> 실습 : kube-ops-view 와 그라파나(22128 , 22251)에서 모니터링
- 그라파나(22128 , 22251) 대시보드 Import 설정
- 샘플 애플리케이션 배포 (덧셈 100만번 수행)
-
더보기<Dockerfile>
FROM php:5-apache
COPY index.php /var/www/html/index.php
RUN chmod a+rx index.php
<index.php>
<?php
$x = 0.0001;
for ($i = 0; $i <= 1000000; $i++) {
$x += sqrt($x);
}
echo "OK!";
?>
# Run and expose php-apache server
cat << EOF > php-apache.yaml
apiVersion: apps/v1
kind: Deployment
metadata:
  name: php-apache
spec:
  selector:
    matchLabels:
      run: php-apache
  template:
    metadata:
      labels:
        run: php-apache
    spec:
      containers:
      - name: php-apache
        image: registry.k8s.io/hpa-example
        ports:
        - containerPort: 80
        resources:
          limits:
            cpu: 500m
          requests:
            cpu: 200m
---
apiVersion: v1
kind: Service
metadata:
  name: php-apache
  labels:
    run: php-apache
spec:
  ports:
  - port: 80
  selector:
    run: php-apache
EOF
kubectl apply -f php-apache.yaml

# 확인
kubectl exec -it deploy/php-apache -- cat /var/www/html/index.php
...

# 모니터링 : 터미널2개 사용
watch -d 'kubectl get hpa,pod;echo;kubectl top pod;echo;kubectl top node'
kubectl exec -it deploy/php-apache -- top

# [운영서버 EC2] 파드IP로 직접 접속
PODIP=$(kubectl get pod -l run=php-apache -o jsonpath="{.items[0].status.podIP}")
curl -s $PODIP; echo
> HPA 정책 생성 및 부하 발생 후 오토 스케일링 테스트 : 증가 시 기본 대기 시간 (30초), 감소 시 기본 대기 시간 (5분) -> 조정가능
# Create the HorizontalPodAutoscaler : requests.cpu=200m - 알고리즘
# Since each pod requests 200 milli-cores by kubectl run, this means an average CPU usage of 100 milli-cores.
cat <<EOF | kubectl apply -f -
apiVersion: autoscaling/v2
kind: HorizontalPodAutoscaler
metadata:
  name: php-apache
spec:
  scaleTargetRef:
    apiVersion: apps/v1
    kind: Deployment
    name: php-apache
  minReplicas: 1
  maxReplicas: 10
  metrics:
  - type: Resource
    resource:
      name: cpu
      target:
        averageUtilization: 50
        type: Utilization
EOF
혹은
kubectl autoscale deployment php-apache --cpu-percent=50 --min=1 --max=10


# 확인
kubectl describe hpa
...
Metrics:                                               ( current / target )
  resource cpu on pods  (as a percentage of request):  0% (1m) / 50%
Min replicas:                                          1
Max replicas:                                          10
Deployment pods:                                       1 current / 1 desired
...

# HPA 설정 확인
kubectl get hpa php-apache -o yaml | kubectl neat
spec:
  minReplicas: 1               # [4] 또는 최소 1개까지 줄어들 수도 있습니다
  maxReplicas: 10              # [3] 포드를 최대 10개까지 늘립니다
  scaleTargetRef:
    apiVersion: apps/v1
    kind: Deployment
    name: php-apache           # [1] php-apache 의 자원 사용량에서
  metrics:
  - type: Resource
    resource:
      name: cpu
      target:
        type: Utilization
        averageUtilization: 50  # [2] CPU 활용률이 50% 이상인 경우

# 반복 접속 1 (파드1 IP로 접속) >> 증가 확인 후 중지
while true;do curl -s $PODIP; sleep 0.5; done

# 반복 접속 2 (서비스명 도메인으로 파드들 분산 접속) >> 증가 확인(몇개까지 증가되는가? 그 이유는?) 후 중지
## >> [scale back down] 중지 5분 후 파드 갯수 감소 확인
# Run this in a separate terminal
# so that the load generation continues and you can carry on with the rest of the steps
kubectl run -i --tty load-generator --rm --image=busybox:1.28 --restart=Never -- /bin/sh -c "while sleep 0.01; do wget -q -O- http://php-apache; done"


# Horizontal Pod Autoscaler Status Conditions
kubectl describe hpa
...
Events:
  Type    Reason             Age    From                       Message
  ----    ------             ----   ----                       -------
  Normal  SuccessfulRescale  13m    horizontal-pod-autoscaler  New size: 2; reason: cpu resource utilization (percentage of request) above target
  Normal  SuccessfulRescale  11m    horizontal-pod-autoscaler  New size: 3; reason: cpu resource utilization (percentage of request) above target
  Normal  SuccessfulRescale  11m    horizontal-pod-autoscaler  New size: 6; reason: cpu resource utilization (percentage of request) above target
  Normal  SuccessfulRescale  10m    horizontal-pod-autoscaler  New size: 8; reason: cpu resource utilization (percentage of request) above target
  Normal  SuccessfulRescale  5m35s  horizontal-pod-autoscaler  New size: 7; reason: All metrics below target
  Normal  SuccessfulRescale  4m35s  horizontal-pod-autoscaler  New size: 5; reason: All metrics below target
  Normal  SuccessfulRescale  4m5s   horizontal-pod-autoscaler  New size: 2; reason: All metrics below target
  Normal  SuccessfulRescale  3m50s  horizontal-pod-autoscaler  New size: 1; reason: All metrics below target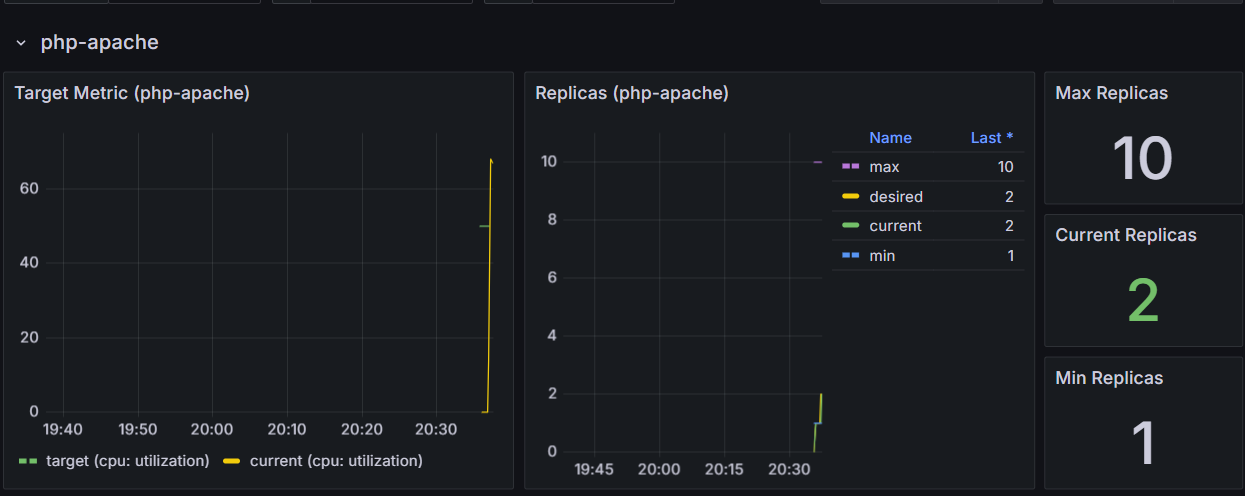


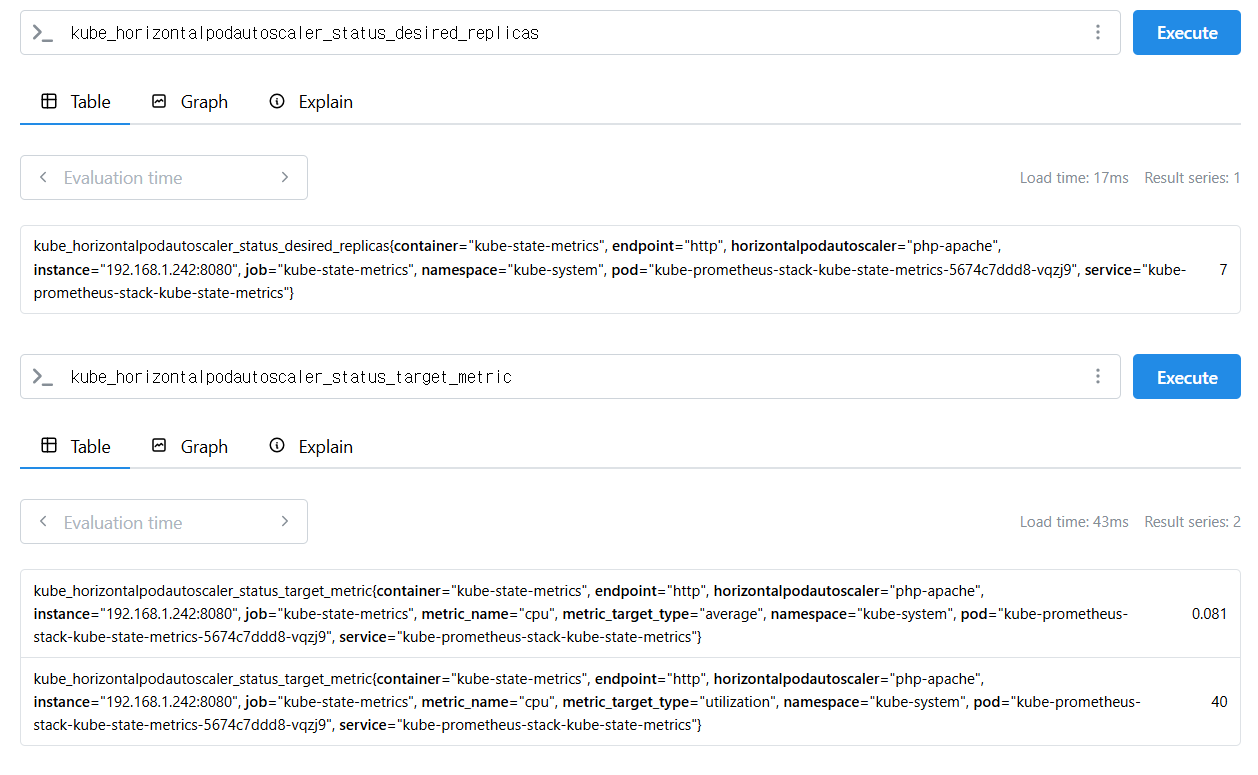
> HPA 프로메테우스 메트릭
kube_horizontalpodautoscaler_status_current_replicas
kube_horizontalpodautoscaler_status_desired_replicas
kube_horizontalpodautoscaler_status_target_metric
kube_horizontalpodautoscaler_status_condition

kube_horizontalpodautoscaler_spec_target_metric
kube_horizontalpodautoscaler_spec_min_replicas
kube_horizontalpodautoscaler_spec_max_replicas

# [운영서버 EC2]
kubectl get pod -n monitoring -l app.kubernetes.io/name=kube-state-metrics -owide
kubectl get pod -n monitoring -l app.kubernetes.io/name=kube-state-metrics -o jsonpath="{.items[*].status.podIP}"
PODIP=$(kubectl get pod -n monitoring -l app.kubernetes.io/name=kube-state-metrics -o jsonpath="{.items[*].status.podIP}")
curl -s http://$PODIP:8080/metrics | grep -i horizontalpodautoscaler | grep HELP
# HELP kube_horizontalpodautoscaler_info Information about this autoscaler.
# HELP kube_horizontalpodautoscaler_metadata_generation [STABLE] The generation observed by the HorizontalPodAutoscaler controller.
# HELP kube_horizontalpodautoscaler_spec_max_replicas [STABLE] Upper limit for the number of pods that can be set by the autoscaler; cannot be smaller than MinReplicas.
# HELP kube_horizontalpodautoscaler_spec_min_replicas [STABLE] Lower limit for the number of pods that can be set by the autoscaler, default 1.
# HELP kube_horizontalpodautoscaler_spec_target_metric The metric specifications used by this autoscaler when calculating the desired replica count.
# HELP kube_horizontalpodautoscaler_status_target_metric The current metric status used by this autoscaler when calculating the desired replica count.
# HELP kube_horizontalpodautoscaler_status_current_replicas [STABLE] Current number of replicas of pods managed by this autoscaler.
# HELP kube_horizontalpodautoscaler_status_desired_replicas [STABLE] Desired number of replicas of pods managed by this autoscaler.
# HELP kube_horizontalpodautoscaler_annotations Kubernetes annotations converted to Prometheus labels.
# HELP kube_horizontalpodautoscaler_labels [STABLE] Kubernetes labels converted to Prometheus labels.
# HELP kube_horizontalpodautoscaler_status_condition [STABLE] The condition of this autoscaler.

curl -s http://$PODIP:8080/metrics | grep -i horizontalpodautoscaler
...
2. KEDA - Kubernetes based Event Driven Autoscaler
. 리소스 메트릭(CPU, Memory)를 기반으로 스케일 여부를 결정하는 HPA를 보완
. 특정 이벤트 기반으로 스케일 여부 결정

- 주요 구성
. Agent : 스케일을 자동으로 조정
. Metrics : 이벤트 데이터 - Horizontal Pod Autoscaler에 전달하여 스케일 아웃 (External Metrics)
. Admission Webhooks : 리소스 변경을 검증하여 잘못된 구성을 방지 (ex. 하나의 스케일 대상에 여러번 스케일링이 일어나는 것을 방지)
kubectl get pod -n keda
NAME                                               READY   STATUS    RESTARTS      AGE
keda-operator-6bdffdc78-5rqnp                      1/1     Running   1 (11m ago)   11m
keda-operator-metrics-apiserver-74d844d769-2vrcq   1/1     Running   0             11m
keda-admission-webhooks-86cffccbf5-kmb7v           1/1     Running   0             11m
> 이벤트(cron 등) 기반 Pod 오토스케일링
. keda 대시보드 import : https://github.com/kedacore/keda/blob/main/config/grafana/keda-dashboard.json
# 설치 전 기존 metrics-server 제공 Metris API 확인
kubectl get --raw "/apis/metrics.k8s.io" -v=6 | jq
kubectl get --raw "/apis/metrics.k8s.io" | jq
{
  "kind": "APIGroup",
  "apiVersion": "v1",
  "name": "metrics.k8s.io",
  ...


# KEDA 설치 : serviceMonitor 만으로도 충분할듯..
cat <<EOT > keda-values.yaml
metricsServer:
  useHostNetwork: true

prometheus:
  metricServer:
    enabled: true
    port: 9022
    portName: metrics
    path: /metrics
    serviceMonitor:
      # Enables ServiceMonitor creation for the Prometheus Operator
      enabled: true
    podMonitor:
      # Enables PodMonitor creation for the Prometheus Operator
      enabled: true
  operator:
    enabled: true
    port: 8080
    serviceMonitor:
      # Enables ServiceMonitor creation for the Prometheus Operator
      enabled: true
    podMonitor:
      # Enables PodMonitor creation for the Prometheus Operator
      enabled: true
  webhooks:
    enabled: true
    port: 8020
    serviceMonitor:
      # Enables ServiceMonitor creation for the Prometheus webhooks
      enabled: true
EOT

helm repo add kedacore https://kedacore.github.io/charts
helm repo update
helm install keda kedacore/keda --version 2.16.0 --namespace keda --create-namespace -f keda-values.yaml

# KEDA 설치 확인
kubectl get crd | grep keda
kubectl get all -n keda
kubectl get validatingwebhookconfigurations keda-admission -o yaml
kubectl get podmonitor,servicemonitors -n keda
kubectl get apiservice v1beta1.external.metrics.k8s.io -o yaml

# CPU/Mem은 기존 metrics-server 의존하여, KEDA metrics-server는 외부 이벤트 소스(Scaler) 메트릭을 노출
## https://keda.sh/docs/2.16/operate/metrics-server/
kubectl get pod -n keda -l app=keda-operator-metrics-apiserver

# Querying metrics exposed by KEDA Metrics Server
kubectl get --raw "/apis/external.metrics.k8s.io/v1beta1" | jq
{
  "kind": "APIResourceList",
  "apiVersion": "v1",
  "groupVersion": "external.metrics.k8s.io/v1beta1",
  "resources": [
    {
      "name": "externalmetrics",
      "singularName": "",
      "namespaced": true,
      "kind": "ExternalMetricValueList",
      "verbs": [
        "get"
      ]
    }
  ]
}

# keda 네임스페이스에 디플로이먼트 생성
kubectl apply -f php-apache.yaml -n keda
kubectl get pod -n keda

# ScaledObject 정책 생성 : cron
cat <<EOT > keda-cron.yaml
apiVersion: keda.sh/v1alpha1
kind: ScaledObject
metadata:
  name: php-apache-cron-scaled
spec:
  minReplicaCount: 0
  maxReplicaCount: 2  # Specifies the maximum number of replicas to scale up to (defaults to 100).
  pollingInterval: 30  # Specifies how often KEDA should check for scaling events
  cooldownPeriod: 300  # Specifies the cool-down period in seconds after a scaling event
  scaleTargetRef:  # Identifies the Kubernetes deployment or other resource that should be scaled.
    apiVersion: apps/v1
    kind: Deployment
    name: php-apache
  triggers:  # Defines the specific configuration for your chosen scaler, including any required parameters or settings
  - type: cron
    metadata:
      timezone: Asia/Seoul
      start: 00,15,30,45 * * * *
      end: 05,20,35,50 * * * *
      desiredReplicas: "1"
EOT
kubectl apply -f keda-cron.yaml -n keda

# 그라파나 대시보드 추가 : 대시보드 상단에 namespace : keda 로 변경하기!
# KEDA 대시보드 Import : https://github.com/kedacore/keda/blob/main/config/grafana/keda-dashboard.json

# 모니터링
watch -d 'kubectl get ScaledObject,hpa,pod -n keda'
kubectl get ScaledObject -w

# 확인
kubectl get ScaledObject,hpa,pod -n keda
kubectl get hpa -o jsonpath="{.items[0].spec}" -n keda | jq
...
"metrics": [
    {
      "external": {
        "metric": {
          "name": "s0-cron-Asia-Seoul-00,15,30,45xxxx-05,20,35,50xxxx",
          "selector": {
            "matchLabels": {
              "scaledobject.keda.sh/name": "php-apache-cron-scaled"
            }
          }
        },
        "target": {
          "averageValue": "1",
          "type": "AverageValue"
        }
      },
      "type": "External"
    }

# KEDA 및 deployment 등 삭제
kubectl delete ScaledObject -n keda php-apache-cron-scaled && kubectl delete deploy php-apache -n keda && helm uninstall keda -n keda
kubectl delete namespace keda


3. VPA - Vertical Pod Autoscaler

. VPA : pod resource.request를 최대한 최적값으로 수정
. HPA와 같이 사용할 수 없음
. 계산 방식 : '기준값(pod가 필요한 최소값)' 결정 -> '마진(버퍼)' 추가

> prometheus custom metric
kube_customresource_vpa_containerrecommendations_target
kube_customresource_vpa_containerrecommendations_target{resource="cpu"}
kube_customresource_vpa_containerrecommendations_target{resource="memory"}
> 그라파나 대시보드 추가 : 14588

# [운영서버 EC2] 코드 다운로드
git clone https://github.com/kubernetes/autoscaler.git # userdata 로 설치 되어 있음
cd ~/autoscaler/vertical-pod-autoscaler/
tree hack

# openssl 버전 확인
openssl version
OpenSSL 1.0.2k-fips  26 Jan 2017

# 1.0 제거
yum remove openssl -y

# openssl 1.1.1 이상 버전 확인
yum install openssl11 -y
openssl11 version
OpenSSL 1.1.1g FIPS  21 Apr 2020

# 스크립트파일내에 openssl11 수정
sed -i 's/openssl/openssl11/g' ~/autoscaler/vertical-pod-autoscaler/pkg/admission-controller/gencerts.sh
git status
git config --global user.email "you@example.com"
git config --global user.name "Your Name"
git add .
git commit -m "openssl version modify"

# Deploy the Vertical Pod Autoscaler to your cluster with the following command.
watch -d kubectl get pod -n kube-system
cat hack/vpa-up.sh
./hack/vpa-up.sh

# 재실행!
sed -i 's/openssl/openssl11/g' ~/autoscaler/vertical-pod-autoscaler/pkg/admission-controller/gencerts.sh
./hack/vpa-up.sh

kubectl get crd | grep autoscaling
kubectl get mutatingwebhookconfigurations vpa-webhook-config
kubectl get mutatingwebhookconfigurations vpa-webhook-config -o json | jq

- KRR : Prometheus-based Kubernetes Resource Recommendations
. 실제 사용량 기준으로 Request와 Limit 사용량을 추천
| 기능 | Robusta KRR | Kubernetes VPA |
|---|---|---|
| 리소스 추천 | 지원됨 (CPU/메모리 요청 및 제한) | 지원됨 (CPU/메모리 요청 및 제한) |
| 설치 위치 | 클러스터 내부에 설치할 필요 없음, 개인 장치에서 실행 가능 (클러스터에 연결) | 클러스터 내부에 설치해야 함 |
| 워크로드 구성 | 각 워크로드별 VPA 객체를 설정할 필요 없음 | 각 워크로드마다 VPA 객체를 설정해야 함 |
| 즉각적인 결과 | Prometheus가 실행 중이라면 즉시 결과 확인 가능 | 데이터 수집 후 일정 시간 경과 후 추천 제공 |
| 보고 기능 | CLI 상세 보고서 제공, Robusta.dev에서 웹 UI 지원 | 지원되지 않음 |
| 확장성 | 몇 줄의 Python 코드로 사용자 정의 전략 추가 가능 | 제한적으로 지원됨 |
| 사용자 정의 메트릭 | 향후 버전에서 지원 예정 | 지원되지 않음 |
| 사용자 정의 리소스 | 향후 버전에서 지원 예정 (예: GPU) | 지원되지 않음 |
| 설명 가능성 | 향후 버전에서 추가 그래프 제공 예정 | 지원되지 않음 |
| 오토스케일링 | 향후 버전에서 지원 예정 | 자동으로 추천 사항 적용 |
4. CAS - Cluster Autoscaler

. Kubernetes 클러스터 크기(노드 수량)를 자동으로 조정
. 모든 Pod가 실행될 수 있도록 보장하고 불필요한 노드를 제거
. 일정 주기로 노드 사용률 확인하여 scale in/out (ASG 활용)
- 단일 Auto Scaling Group 사용
- 다중 Auto Scaling Group 사용
- Auto-Discovery(자동 검색) 사용 (권장 방법) - Auto-Discovery를 활용하여 자동으로 ASG를 감지하고 관리
- 컨트롤 플레인 노드 설정
. Launch Configuration 또는 Launch Template 인스턴스 타입을 기반으로 CPU, 메모리, GPU 리소스를 자동으로 판단
. 하나의 자원에 대해 두군데 (AWS ASG vs AWS EKS)에서 각자의 방식으로 관리 ⇒ 관리 정보가 서로 동기화되지 않아 다양한 문제 발생
- ASG에만 의존하고 노드 생성/삭제 등에 직접 관여 안함
- EKS에서 노드를 삭제 해도 인스턴스는 삭제 안됨
- 노드 축소 될 때 특정 노드가 축소 되도록 하기 매우 어려움
- 특정 노드를 삭제 하면서 동시에 노드 개수를 줄이기 어려움
- 폴링 방식이기에 너무 자주 확장 여유를 확인 하면 API 제한에 도달할 수 있음
- 스케일링 속도 느림
- Pending 상태의 파드가 생길 때 동작 노드 부하 평균이 아니라 Request 값 기반 스케일링
- Request를 과소 설정하면 스케일 아웃이 지연, 과대 설정하면 불필요한 스케일 아웃 발생
- CPU뿐만 아니라 메모리 리소스도 동일한 방식

# EKS 노드에 이미 아래 tag가 들어가 있음
# k8s.io/cluster-autoscaler/enabled : true
# k8s.io/cluster-autoscaler/myeks : owned
aws ec2 describe-instances  --filters Name=tag:Name,Values=$CLUSTER_NAME-ng1-Node --query "Reservations[*].Instances[*].Tags[*]" --output json | jq
aws ec2 describe-instances  --filters Name=tag:Name,Values=$CLUSTER_NAME-ng1-Node --query "Reservations[*].Instances[*].Tags[*]" --output yaml
...
- Key: k8s.io/cluster-autoscaler/myeks
      Value: owned
- Key: k8s.io/cluster-autoscaler/enabled
      Value: 'true'
...
> CAS 설치
# 현재 autoscaling(ASG) 정보 확인
# aws autoscaling describe-auto-scaling-groups --query "AutoScalingGroups[? Tags[? (Key=='eks:cluster-name') && Value=='클러스터이름']].[AutoScalingGroupName, MinSize, MaxSize,DesiredCapacity]" --output table
aws autoscaling describe-auto-scaling-groups \
--query "AutoScalingGroups[? Tags[? (Key=='eks:cluster-name') && Value=='myeks']].[AutoScalingGroupName, MinSize, MaxSize,DesiredCapacity]" \
--output table
-----------------------------------------------------------------
| DescribeAutoScalingGroups |
+------------------------------------------------+----+----+----+
| eks-ng1-44c41109-daa3-134c-df0e-0f28c823cb47 | 3 | 3 | 3 |
+------------------------------------------------+----+----+----+
# MaxSize 6개로 수정
export ASG_NAME=$(aws autoscaling describe-auto-scaling-groups --query "AutoScalingGroups[? Tags[? (Key=='eks:cluster-name') && Value=='myeks']].AutoScalingGroupName" --output text)
aws autoscaling update-auto-scaling-group --auto-scaling-group-name ${ASG_NAME} --min-size 3 --desired-capacity 3 --max-size 6
# 확인
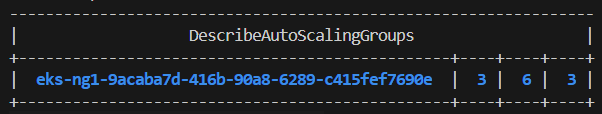
aws autoscaling describe-auto-scaling-groups --query "AutoScalingGroups[? Tags[? (Key=='eks:cluster-name') && Value=='myeks']].[AutoScalingGroupName, MinSize, MaxSize,DesiredCapacity]" --output table
-----------------------------------------------------------------
| DescribeAutoScalingGroups |
+------------------------------------------------+----+----+----+
| eks-ng1-c2c41e26-6213-a429-9a58-02374389d5c3 | 3 | 6 | 3 |
+------------------------------------------------+----+----+----+
# 배포 : Deploy the Cluster Autoscaler (CAS)
curl -s -O https://raw.githubusercontent.com/kubernetes/autoscaler/master/cluster-autoscaler/cloudprovider/aws/examples/cluster-autoscaler-autodiscover.yaml
...
- ./cluster-autoscaler
- --v=4
- --stderrthreshold=info
- --cloud-provider=aws
- --skip-nodes-with-local-storage=false # 로컬 스토리지를 가진 노드를 autoscaler가 scale down할지 결정, false(가능!)
- --expander=least-waste # 노드를 확장할 때 어떤 노드 그룹을 선택할지를 결정, least-waste는 리소스 낭비를 최소화하는 방식으로 새로운 노드를 선택.
- --node-group-auto-discovery=asg:tag=k8s.io/cluster-autoscaler/enabled,k8s.io/cluster-autoscaler/<YOUR CLUSTER NAME>
...
sed -i -e "s|<YOUR CLUSTER NAME>|$CLUSTER_NAME|g" cluster-autoscaler-autodiscover.yaml
kubectl apply -f cluster-autoscaler-autodiscover.yaml
# 확인
kubectl get pod -n kube-system | grep cluster-autoscaler
kubectl describe deployments.apps -n kube-system cluster-autoscaler
kubectl describe deployments.apps -n kube-system cluster-autoscaler | grep node-group-auto-discovery
--node-group-auto-discovery=asg:tag=k8s.io/cluster-autoscaler/enabled,k8s.io/cluster-autoscaler/myeks
# (옵션) cluster-autoscaler 파드가 동작하는 워커 노드가 퇴출(evict) 되지 않게 설정
kubectl -n kube-system annotate deployment.apps/cluster-autoscaler cluster-autoscaler.kubernetes.io/safe-to-evict="false"
> scaling 확인하기
# 모니터링
kubectl get nodes -w
while true; do kubectl get node; echo "------------------------------" ; date ; sleep 1; done
while true; do aws ec2 describe-instances --query "Reservations[*].Instances[*].{PrivateIPAdd:PrivateIpAddress,InstanceName:Tags[?Key=='Name']|[0].Value,Status:State.Name}" --filters Name=instance-state-name,Values=running --output text ; echo "------------------------------"; date; sleep 1; done

# Deploy a Sample App
# We will deploy an sample nginx application as a ReplicaSet of 1 Pod
cat << EOF > nginx.yaml
apiVersion: apps/v1
kind: Deployment
metadata:
  name: nginx-to-scaleout
spec:
  replicas: 1
  selector:
    matchLabels:
      app: nginx
  template:
    metadata:
      labels:
        service: nginx
        app: nginx
    spec:
      containers:
      - image: nginx
        name: nginx-to-scaleout
        resources:
          limits:
            cpu: 500m
            memory: 512Mi
          requests:
            cpu: 500m
            memory: 512Mi
EOF
kubectl apply -f nginx.yaml
kubectl get deployment/nginx-to-scaleout

# Scale our ReplicaSet
# Let’s scale out the replicaset to 15
kubectl scale --replicas=15 deployment/nginx-to-scaleout && date

# 확인
kubectl get pods -l app=nginx -o wide --watch
kubectl -n kube-system logs -f deployment/cluster-autoscaler

# 노드 자동 증가 확인
kubectl get nodes
aws autoscaling describe-auto-scaling-groups \
    --query "AutoScalingGroups[? Tags[? (Key=='eks:cluster-name') && Value=='myeks']].[AutoScalingGroupName, MinSize, MaxSize,DesiredCapacity]" \
    --output table

eks-node-viewer --resources cpu,memory
혹은
eks-node-viewer

# [운영서버 EC2] 최근 1시간 Fleet API 호출 확인 - Link
# https://ap-northeast-2.console.aws.amazon.com/cloudtrailv2/home?region=ap-northeast-2#/events?EventName=CreateFleet
aws cloudtrail lookup-events \
  --lookup-attributes AttributeKey=EventName,AttributeValue=CreateFleet \
  --start-time "$(date -d '1 hour ago' --utc +%Y-%m-%dT%H:%M:%SZ)" \
  --end-time "$(date --utc +%Y-%m-%dT%H:%M:%SZ)"

# (참고) Event name : UpdateAutoScalingGroup
# https://ap-northeast-2.console.aws.amazon.com/cloudtrailv2/home?region=ap-northeast-2#/events?EventName=UpdateAutoScalingGroup


# 디플로이먼트 삭제
kubectl delete -f nginx.yaml && date

# [scale-down] 노드 갯수 축소 : 기본은 10분 후 scale down 됨, 물론 아래 flag 로 시간 수정 가능 >> 그러니 디플로이먼트 삭제 후 10분 기다리고 나서 보자!
# By default, cluster autoscaler will wait 10 minutes between scale down operations,
# you can adjust this using the --scale-down-delay-after-add, --scale-down-delay-after-delete,
# and --scale-down-delay-after-failure flag.
# E.g. --scale-down-delay-after-add=5m to decrease the scale down delay to 5 minutes after a node has been added.

# 터미널1
watch -d kubectl get node


>리소스 삭제
# 위 실습 중 디플로이먼트 삭제 후 10분 후 노드 갯수 축소되는 것을 확인 후 아래 삭제를 해보자! >> 만약 바로 아래 CA 삭제 시 워커 노드는 4개 상태가 되어서 수동으로 2대 변경 하자!
kubectl delete -f nginx.yaml

# size 수정
aws autoscaling update-auto-scaling-group --auto-scaling-group-name ${ASG_NAME} --min-size 3 --desired-capacity 3 --max-size 3
aws autoscaling describe-auto-scaling-groups --query "AutoScalingGroups[? Tags[? (Key=='eks:cluster-name') && Value=='myeks']].[AutoScalingGroupName, MinSize, MaxSize,DesiredCapacity]" --output table

# Cluster Autoscaler 삭제
kubectl delete -f cluster-autoscaler-autodiscover.yaml
5. CPA - Cluster Proportional Autoscaler

. 노드 수 증가에 비례하여 성능 처리가 필요한 애플리케이션(컨테이너/파드)를 수평으로 자동 확장
#
helm repo add cluster-proportional-autoscaler https://kubernetes-sigs.github.io/cluster-proportional-autoscaler

# CPA규칙을 설정하고 helm차트를 릴리즈 필요
helm upgrade --install cluster-proportional-autoscaler cluster-proportional-autoscaler/cluster-proportional-autoscaler

# nginx 디플로이먼트 배포
cat <<EOT > cpa-nginx.yaml
apiVersion: apps/v1
kind: Deployment
metadata:
  name: nginx-deployment
spec:
  replicas: 1
  selector:
    matchLabels:
      app: nginx
  template:
    metadata:
      labels:
        app: nginx
    spec:
      containers:
      - name: nginx
        image: nginx:latest
        resources:
          limits:
            cpu: "100m"
            memory: "64Mi"
          requests:
            cpu: "100m"
            memory: "64Mi"
        ports:
        - containerPort: 80
EOT
kubectl apply -f cpa-nginx.yaml

# CPA 규칙 설정
cat <<EOF > cpa-values.yaml
config:
  ladder:
    nodesToReplicas:
      - [1, 1]
      - [2, 2]
      - [3, 3]
      - [4, 3]
      - [5, 5]
options:
  namespace: default
  target: "deployment/nginx-deployment"
EOF
kubectl describe cm cluster-proportional-autoscaler

# 모니터링
watch -d kubectl get pod

# helm 업그레이드
helm upgrade --install cluster-proportional-autoscaler -f cpa-values.yaml cluster-proportional-autoscaler/cluster-proportional-autoscaler

# 노드 5개로 증가
export ASG_NAME=$(aws autoscaling describe-auto-scaling-groups --query "AutoScalingGroups[? Tags[? (Key=='eks:cluster-name') && Value=='myeks']].AutoScalingGroupName" --output text)
aws autoscaling update-auto-scaling-group --auto-scaling-group-name ${ASG_NAME} --min-size 5 --desired-capacity 5 --max-size 5
aws autoscaling describe-auto-scaling-groups --query "AutoScalingGroups[? Tags[? (Key=='eks:cluster-name') && Value=='myeks']].[AutoScalingGroupName, MinSize, MaxSize,DesiredCapacity]" --output table

# 노드 4개로 축소
aws autoscaling update-auto-scaling-group --auto-scaling-group-name ${ASG_NAME} --min-size 4 --desired-capacity 4 --max-size 4
aws autoscaling describe-auto-scaling-groups --query "AutoScalingGroups[? Tags[? (Key=='eks:cluster-name') && Value=='myeks']].[AutoScalingGroupName, MinSize, MaxSize,DesiredCapacity]" --output table


6. Karpenter

. 고성능의 지능형 k8s 컴퓨팅 프로비저닝 및 관리 솔루션
. 수초 이내에 대응 가능
.더 낮은 컴퓨팅 비용으로 노드 선택
- 지능형의 동적인 인스턴스 유형 선택 - Spot, AWS Graviton 등
- 자동 워크로드 Consolidation 기능
- 일관성 있는 더 빠른 노드 구동시간을 통해 시간/비용 낭비 최소화
- 실습 준비
- 도구설치
- AWS CLI : 자격증명 설정
- kubectl - the Kubernetes CLI
- eksctl (>= v0.202.0) - the CLI for AWS EKS
- helm - the package manager for Kubernetes
- eks-node-view
- 환경 변수 세팅
# 변수 설정
export KARPENTER_NAMESPACE="kube-system"
export KARPENTER_VERSION="1.2.1"
export K8S_VERSION="1.32"

export AWS_PARTITION="aws" # if you are not using standard partitions, you may need to configure to aws-cn / aws-us-gov
export CLUSTER_NAME="gasida-karpenter-demo" # ${USER}-karpenter-demo
export AWS_DEFAULT_REGION="ap-northeast-2"
export AWS_ACCOUNT_ID="$(aws sts get-caller-identity --query Account --output text)"
export TEMPOUT="$(mktemp)"
export ALIAS_VERSION="$(aws ssm get-parameter --name "/aws/service/eks/optimized-ami/${K8S_VERSION}/amazon-linux-2023/x86_64/standard/recommended/image_id" --query Parameter.Value | xargs aws ec2 describe-images --query 'Images[0].Name' --image-ids | sed -r 's/^.*(v[[:digit:]]+).*$/\1/')"

# 확인
echo "${KARPENTER_NAMESPACE}" "${KARPENTER_VERSION}" "${K8S_VERSION}" "${CLUSTER_NAME}" "${AWS_DEFAULT_REGION}" "${AWS_ACCOUNT_ID}" "${TEMPOUT}" "${ALIAS_VERSION}"
3. 클러스터 설치
# CloudFormation 스택으로 IAM Policy/Role, SQS, Event/Rule 생성 : 3분 정도 소요
## IAM Policy : KarpenterControllerPolicy-gasida-karpenter-demo
## IAM Role : KarpenterNodeRole-gasida-karpenter-demo
curl -fsSL https://raw.githubusercontent.com/aws/karpenter-provider-aws/v"${KARPENTER_VERSION}"/website/content/en/preview/getting-started/getting-started-with-karpenter/cloudformation.yaml > "${TEMPOUT}" \
&& aws cloudformation deploy \
--stack-name "Karpenter-${CLUSTER_NAME}" \
--template-file "${TEMPOUT}" \
--capabilities CAPABILITY_NAMED_IAM \
--parameter-overrides "ClusterName=${CLUSTER_NAME}"
# 클러스터 생성 : EKS 클러스터 생성 15분 정도 소요
eksctl create cluster -f - <<EOF
---
apiVersion: eksctl.io/v1alpha5
kind: ClusterConfig
metadata:
name: ${CLUSTER_NAME}
region: ${AWS_DEFAULT_REGION}
version: "${K8S_VERSION}"
tags:
karpenter.sh/discovery: ${CLUSTER_NAME}
iam:
withOIDC: true
podIdentityAssociations:
- namespace: "${KARPENTER_NAMESPACE}"
serviceAccountName: karpenter
roleName: ${CLUSTER_NAME}-karpenter
permissionPolicyARNs:
- arn:${AWS_PARTITION}:iam::${AWS_ACCOUNT_ID}:policy/KarpenterControllerPolicy-${CLUSTER_NAME}
iamIdentityMappings:
- arn: "arn:${AWS_PARTITION}:iam::${AWS_ACCOUNT_ID}:role/KarpenterNodeRole-${CLUSTER_NAME}"
username: system:node:{{EC2PrivateDNSName}}
groups:
- system:bootstrappers
- system:nodes
## If you intend to run Windows workloads, the kube-proxy group should be specified.
# For more information, see https://github.com/aws/karpenter/issues/5099.
# - eks:kube-proxy-windows
managedNodeGroups:
- instanceType: m5.large
amiFamily: AmazonLinux2023
name: ${CLUSTER_NAME}-ng
desiredCapacity: 2
minSize: 1
maxSize: 10
iam:
withAddonPolicies:
externalDNS: true
addons:
- name: eks-pod-identity-agent
EOF
# eks 배포 확인
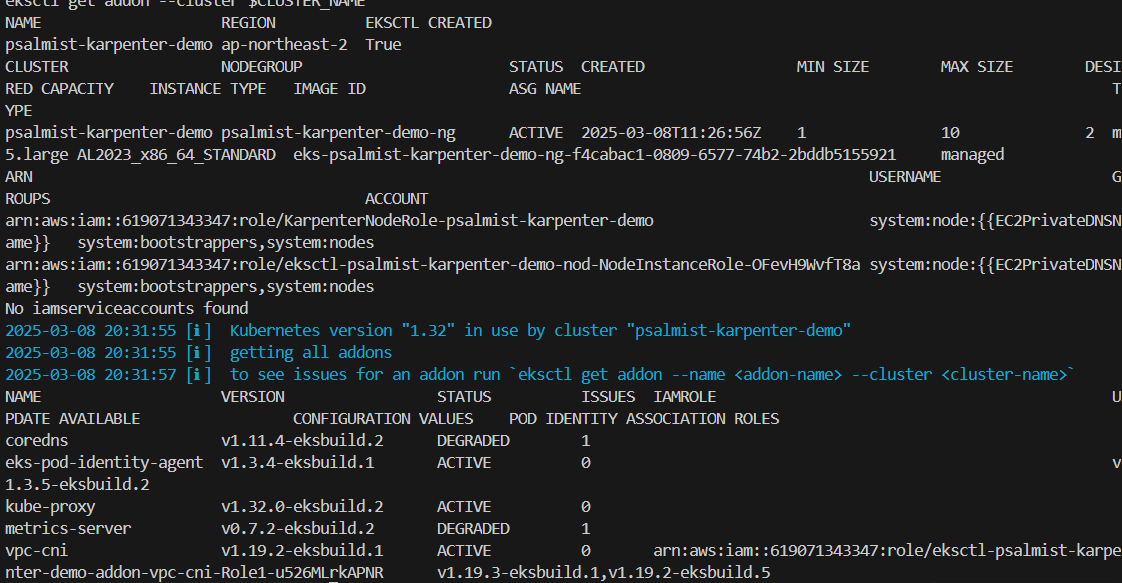
eksctl get cluster
eksctl get nodegroup --cluster $CLUSTER_NAME
eksctl get iamidentitymapping --cluster $CLUSTER_NAME
eksctl get iamserviceaccount --cluster $CLUSTER_NAME
eksctl get addon --cluster $CLUSTER_NAME
#
kubectl ctx
kubectl config rename-context "<각자 자신의 IAM User>@<자신의 Nickname>-karpenter-demo.ap-northeast-2.eksctl.io" "karpenter-demo"
kubectl config rename-context "admin@gasida-karpenter-demo.ap-northeast-2.eksctl.io" "karpenter-demo"
# k8s 확인
kubectl ns default
kubectl cluster-info
kubectl get node --label-columns=node.kubernetes.io/instance-type,eks.amazonaws.com/capacityType,topology.kubernetes.io/zone
kubectl get pod -n kube-system -owide
kubectl get pdb -A
kubectl describe cm -n kube-system aws-auth
# EC2 Spot Fleet의 service-linked-role 생성 확인 : 만들어있는것을 확인하는 거라 아래 에러 출력이 정상!
# If the role has already been successfully created, you will see:
# An error occurred (InvalidInput) when calling the CreateServiceLinkedRole operation: Service role name AWSServiceRoleForEC2Spot has been taken in this account, please try a different suffix.
aws iam create-service-linked-role --aws-service-name spot.amazonaws.com || true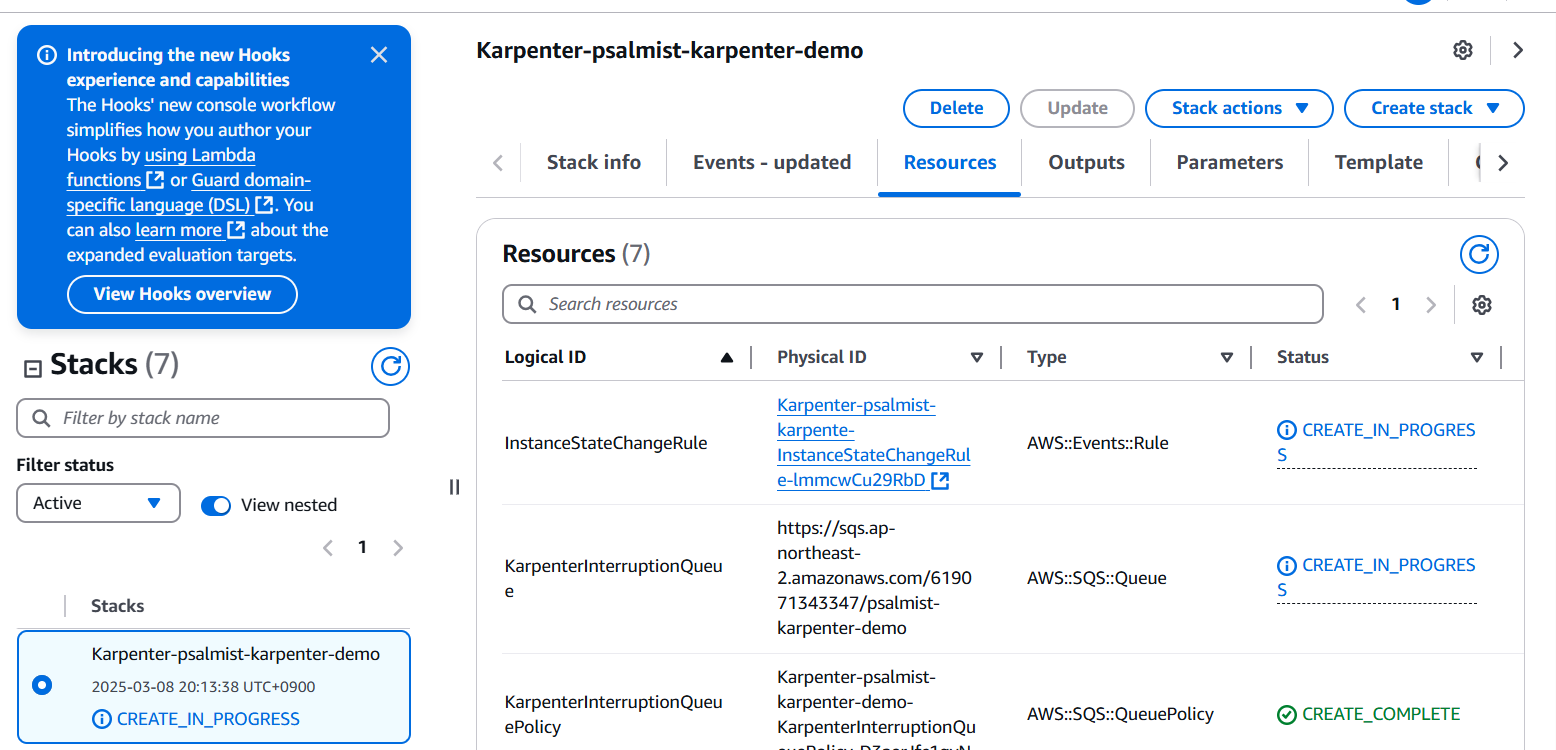
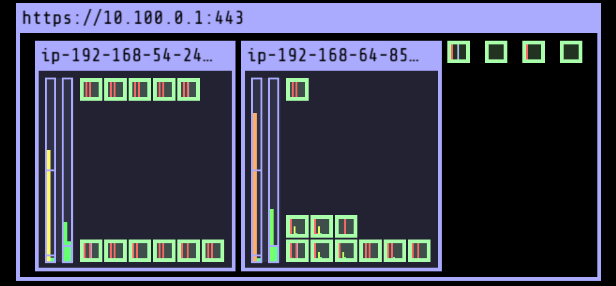
> kube-ops-view 설치
# kube-ops-view
helm repo add geek-cookbook https://geek-cookbook.github.io/charts/
helm install kube-ops-view geek-cookbook/kube-ops-view --version 1.2.2 --set service.main.type=LoadBalancer --set env.TZ="Asia/Seoul" --namespace kube-system
echo -e "http://$(kubectl get svc -n kube-system kube-ops-view -o jsonpath="{.status.loadBalancer.ingress[0].hostname}"):8080/#scale=1.5"
open "http://$(kubectl get svc -n kube-system kube-ops-view -o jsonpath="{.status.loadBalancer.ingress[0].hostname}"):8080/#scale=1.5"
4. 카펜터 설치
# Logout of helm registry to perform an unauthenticated pull against the public ECR
helm registry logout public.ecr.aws

# Karpenter 설치를 위한 변수 설정 및 확인
export CLUSTER_ENDPOINT="$(aws eks describe-cluster --name "${CLUSTER_NAME}" --query "cluster.endpoint" --output text)"
export KARPENTER_IAM_ROLE_ARN="arn:${AWS_PARTITION}:iam::${AWS_ACCOUNT_ID}:role/${CLUSTER_NAME}-karpenter"
echo "${CLUSTER_ENDPOINT} ${KARPENTER_IAM_ROLE_ARN}"

# karpenter 설치
helm upgrade --install karpenter oci://public.ecr.aws/karpenter/karpenter --version "${KARPENTER_VERSION}" --namespace "${KARPENTER_NAMESPACE}" --create-namespace \
  --set "settings.clusterName=${CLUSTER_NAME}" \
  --set "settings.interruptionQueue=${CLUSTER_NAME}" \
  --set controller.resources.requests.cpu=1 \
  --set controller.resources.requests.memory=1Gi \
  --set controller.resources.limits.cpu=1 \
  --set controller.resources.limits.memory=1Gi \
  --wait

# 확인
helm list -n kube-system
kubectl get-all -n $KARPENTER_NAMESPACE
kubectl get all -n $KARPENTER_NAMESPACE
kubectl get crd | grep karpenter
ec2nodeclasses.karpenter.k8s.aws             2025-03-02T06:11:47Z
nodeclaims.karpenter.sh                      2025-03-02T06:11:47Z
nodepools.karpenter.sh                       2025-03-02T06:11:47Z
5. 프로메테우스, 그라파나 설치
#
helm repo add grafana-charts https://grafana.github.io/helm-charts
helm repo add prometheus-community https://prometheus-community.github.io/helm-charts
helm repo update
kubectl create namespace monitoring

# 프로메테우스 설치
curl -fsSL https://raw.githubusercontent.com/aws/karpenter-provider-aws/v"${KARPENTER_VERSION}"/website/content/en/preview/getting-started/getting-started-with-karpenter/prometheus-values.yaml | envsubst | tee prometheus-values.yaml
helm install --namespace monitoring prometheus prometheus-community/prometheus --values prometheus-values.yaml
extraScrapeConfigs: |
    - job_name: karpenter
      kubernetes_sd_configs:
      - role: endpoints
        namespaces:
          names:
          - kube-system
      relabel_configs:
      - source_labels:
        - __meta_kubernetes_endpoints_name
        - __meta_kubernetes_endpoint_port_name
        action: keep
        regex: karpenter;http-metrics

# 프로메테우스 얼럿매니저 미사용으로 삭제
kubectl delete sts -n monitoring prometheus-alertmanager

# 프로메테우스 접속 설정
export POD_NAME=$(kubectl get pods --namespace monitoring -l "app.kubernetes.io/name=prometheus,app.kubernetes.io/instance=prometheus" -o jsonpath="{.items[0].metadata.name}")
kubectl --namespace monitoring port-forward $POD_NAME 9090 &
open http://127.0.0.1:9090

# 그라파나 설치
curl -fsSL https://raw.githubusercontent.com/aws/karpenter-provider-aws/v"${KARPENTER_VERSION}"/website/content/en/preview/getting-started/getting-started-with-karpenter/grafana-values.yaml | tee grafana-values.yaml
helm install --namespace monitoring grafana grafana-charts/grafana --values grafana-values.yaml
datasources:
  datasources.yaml:
    apiVersion: 1
    datasources:
    - name: Prometheus
      type: prometheus
      version: 1
      url: http://prometheus-server:80
      access: proxy
dashboardProviders:
  dashboardproviders.yaml:
    apiVersion: 1
    providers:
    - name: 'default'
      orgId: 1
      folder: ''
      type: file
      disableDeletion: false
      editable: true
      options:
        path: /var/lib/grafana/dashboards/default
dashboards:
  default:
    capacity-dashboard:
      url: https://karpenter.sh/preview/getting-started/getting-started-with-karpenter/karpenter-capacity-dashboard.json
    performance-dashboard:
      url: https://karpenter.sh/preview/getting-started/getting-started-with-karpenter/karpenter-performance-dashboard.json

# admin 암호
kubectl get secret --namespace monitoring grafana -o jsonpath="{.data.admin-password}" | base64 --decode ; echo
17JUGSjgxK20m4NEnAaG7GzyBjqAMHMFxRnXItLj

# 그라파나 접속
kubectl port-forward --namespace monitoring svc/grafana 3000:80 &
open http://127.0.0.1:3000
6. Create NodePool (구 Provisioner)

- 관리 리소스:
. securityGroupSelector와 subnetSelector를 사용하여 관리 리소스를 찾음
- consolidationPolicy (미사용 노드 정리 정책):
. 데몬셋은 제외됨
. WhenEmptyOrUnderutilized 설정 시 Karpenter는 비용 절감을 위해 노드를 제거하고 교체
. consolidateAfter: Never 설정시 노드 통합을 비활성화함
- 단일 Karpenter NodePool:
. 여러 노드 그룹을 관리할 필요 없이 하나의 NodePool로 모든 Pod 스케줄, 프로비저닝 결정 (라벨 등)
- NodePool 생성:
. 기본 NodePool을 생성할 때 securityGroupSelectorTerms와 subnetSelectorTerms로 리소스를 검색
. karpenter.sh/discovery 태그를 적용
- NodePool의 용량 관리:
. NodePool은 생성된 모든 용량의 합계가 지정된 한도보다 작은 한도 내에서 용량 생성.
> 실습
#
echo $ALIAS_VERSION
v20250228

#
cat <<EOF | envsubst | kubectl apply -f -
apiVersion: karpenter.sh/v1
kind: NodePool
metadata:
  name: default
spec:
  template:
    spec:
      requirements:
        - key: kubernetes.io/arch
          operator: In
          values: ["amd64"]
        - key: kubernetes.io/os
          operator: In
          values: ["linux"]
        - key: karpenter.sh/capacity-type
          operator: In
          values: ["on-demand"]
        - key: karpenter.k8s.aws/instance-category
          operator: In
          values: ["c", "m", "r"]
        - key: karpenter.k8s.aws/instance-generation
          operator: Gt
          values: ["2"]
      nodeClassRef:
        group: karpenter.k8s.aws
        kind: EC2NodeClass
        name: default
      expireAfter: 720h # 30 * 24h = 720h
  limits:
    cpu: 1000
  disruption:
    consolidationPolicy: WhenEmptyOrUnderutilized
    consolidateAfter: 1m
---
apiVersion: karpenter.k8s.aws/v1
kind: EC2NodeClass
metadata:
  name: default
spec:
  role: "KarpenterNodeRole-${CLUSTER_NAME}" # replace with your cluster name
  amiSelectorTerms:
    - alias: "al2023@${ALIAS_VERSION}" # ex) al2023@latest
  subnetSelectorTerms:
    - tags:
        karpenter.sh/discovery: "${CLUSTER_NAME}" # replace with your cluster name
  securityGroupSelectorTerms:
    - tags:
        karpenter.sh/discovery: "${CLUSTER_NAME}" # replace with your cluster name
EOF

# 확인
kubectl get nodepool,ec2nodeclass,nodeclaims
> Deployment 스케일 Out
# pause 파드 1개에 CPU 1개 최소 보장 할당할 수 있게 디플로이먼트 배포
cat <<EOF | kubectl apply -f -
apiVersion: apps/v1
kind: Deployment
metadata:
  name: inflate
spec:
  replicas: 0
  selector:
    matchLabels:
      app: inflate
  template:
    metadata:
      labels:
        app: inflate
    spec:
      terminationGracePeriodSeconds: 0
      securityContext:
        runAsUser: 1000
        runAsGroup: 3000
        fsGroup: 2000
      containers:
      - name: inflate
        image: public.ecr.aws/eks-distro/kubernetes/pause:3.7
        resources:
          requests:
            cpu: 1
        securityContext:
          allowPrivilegeEscalation: false
EOF

# [신규 터미널] 모니터링
eks-node-viewer --resources cpu,memory
eks-node-viewer --resources cpu,memory --node-selector "karpenter.sh/registered=true" --extra-labels eks-node-viewer/node-age


# Scale up
kubectl get pod
kubectl scale deployment inflate --replicas 5

# 출력 로그 분석해보자!
kubectl logs -f -n "${KARPENTER_NAMESPACE}" -l app.kubernetes.io/name=karpenter -c controller
kubectl logs -f -n "${KARPENTER_NAMESPACE}" -l app.kubernetes.io/name=karpenter -c controller | jq '.'
kubectl logs -n "${KARPENTER_NAMESPACE}" -l app.kubernetes.io/name=karpenter -c controller | grep 'launched nodeclaim' | jq '.'
{
  "level": "INFO",
  "time": "2025-03-02T07:43:14.316Z",
  "logger": "controller",
  "message": "launched nodeclaim",
  "commit": "058c665",
  "controller": "nodeclaim.lifecycle",
  "controllerGroup": "karpenter.sh",
  "controllerKind": "NodeClaim",
  "NodeClaim": {
    "name": "default-x7ntc"
  },
  "namespace": "",
  "name": "default-x7ntc",
  "reconcileID": "51854f39-e885-45a5-895c-e55a15b160f0",
  "provider-id": "aws:///ap-northeast-2c/i-062705e52143939a6",
  "instance-type": "c5a.2xlarge",
  "zone": "ap-northeast-2c",
  "capacity-type": "on-demand",
  "allocatable": {
    "cpu": "7910m",
    "ephemeral-storage": "17Gi",
    "memory": "14162Mi",
    "pods": "58",
    "vpc.amazonaws.com/pod-eni": "38"
  }
}

# 확인
kubectl get nodeclaims
NAME            TYPE          CAPACITY    ZONE              NODE                                                 READY   AGE
default-8f5vd   c5a.2xlarge   on-demand   ap-northeast-2c   ip-192-168-176-171.ap-northeast-2.compute.internal   True    79s

kubectl describe nodeclaims
...
Spec:
  Expire After:  720h
  Node Class Ref:
    Group:  karpenter.k8s.aws
    Kind:   EC2NodeClass
    Name:   default
  Requirements:
    Key:       karpenter.k8s.aws/instance-category
    Operator:  In
    Values:
      c
      m
      r
    Key:       node.kubernetes.io/instance-type
    Operator:  In
    Values:
      c4.2xlarge
      c4.4xlarge
      c5.2xlarge
      c5.4xlarge
      c5a.2xlarge
      c5a.4xlarge
      c5a.8xlarge
      c5d.2xlarge
      c5d.4xlarge
      ...
    ...
    Key:       karpenter.sh/capacity-type
    Operator:  In
    Values:
      on-demand
  Resources:
    Requests:
      Cpu:   4150m
      Pods:  8
Status:
  Allocatable:
    Cpu:                        7910m
    Ephemeral - Storage:        17Gi
    Memory:                     14162Mi
    Pods:                       58
    vpc.amazonaws.com/pod-eni:  38
  Capacity:
    Cpu:                        8
    Ephemeral - Storage:        20Gi
    Memory:                     15155Mi
    Pods:                       58
    vpc.amazonaws.com/pod-eni:  38
...

#
kubectl get node -l karpenter.sh/registered=true -o jsonpath="{.items[0].metadata.labels}" | jq '.'
...
  "karpenter.sh/initialized": "true",
  "karpenter.sh/nodepool": "default",
  "karpenter.sh/registered": "true",
...

# (옵션) 더욱 더 Scale up!
kubectl scale deployment inflate --replicas 30
> Scale In 실습
# Now, delete the deployment. After a short amount of time, Karpenter should terminate the empty nodes due to consolidation.
kubectl delete deployment inflate && date
# 출력 로그 분석해보자!
kubectl logs -f -n "${KARPENTER_NAMESPACE}" -l app.kubernetes.io/name=karpenter -c controller | jq '.'
...
{
  "level": "INFO",
  "time": "2025-03-02T06:53:28.780Z",
  "logger": "controller",
  "message": "disrupting nodeclaim(s) via delete, terminating 1 nodes (1 pods) ip-192-168-131-97.ap-northeast-2.compute.internal/c5a.large/on-demand",
  "commit": "058c665",
  "controller": "disruption",
  "namespace": "",
  "name": "",
  "reconcileID": "86a3a45c-2604-4a71-808a-21290301d096",
  "command-id": "51914aee-4e09-436f-af6d-794163c3d1c2",
  "reason": "underutilized"
}
{
  "level": "INFO",
  "time": "2025-03-02T06:53:29.532Z",
  "logger": "controller",
  "message": "tainted node",
  "commit": "058c665",
  "controller": "node.termination",
  "controllerGroup": "",
  "controllerKind": "Node",
  "Node": {
    "name": "ip-192-168-131-97.ap-northeast-2.compute.internal"
  },
  "namespace": "",
  "name": "ip-192-168-131-97.ap-northeast-2.compute.internal",
  "reconcileID": "617bcb4d-5498-44d9-ba1e-6c8b7d97c405",
  "taint.Key": "karpenter.sh/disrupted",
  "taint.Value": "",
  "taint.Effect": "NoSchedule"
}
{
  "level": "INFO",
  "time": "2025-03-02T06:54:03.234Z",
  "logger": "controller",
  "message": "deleted node",
  "commit": "058c665",
  "controller": "node.termination",
  "controllerGroup": "",
  "controllerKind": "Node",
  "Node": {
    "name": "ip-192-168-131-97.ap-northeast-2.compute.internal"
  },
  "namespace": "",
  "name": "ip-192-168-131-97.ap-northeast-2.compute.internal",
  "reconcileID": "8c71fb19-b7ae-4037-afef-fbf1c7343f84"
}
{
  "level": "INFO",
  "time": "2025-03-02T06:54:03.488Z",
  "logger": "controller",
  "message": "deleted nodeclaim",
  "commit": "058c665",
  "controller": "nodeclaim.lifecycle",
  "controllerGroup": "karpenter.sh",
  "controllerKind": "NodeClaim",
  "NodeClaim": {
    "name": "default-mfkgp"
  },
  "namespace": "",
  "name": "default-mfkgp",
  "reconcileID": "757b4d88-2bf2-412c-bf83-3149f9517d85",
  "Node": {
    "name": "ip-192-168-131-97.ap-northeast-2.compute.internal"
  },
  "provider-id": "aws:///ap-northeast-2a/i-00f22c8bde3faf646"
}
{
  "level": "INFO",
  "time": "2025-03-02T07:25:55.661Z",
  "logger": "controller",
  "message": "disrupting nodeclaim(s) via delete, terminating 1 nodes (0 pods) ip-192-168-176-171.ap-northeast-2.compute.internal/c5a.2xlarge/on-demand",
  "commit": "058c665",
  "controller": "disruption",
  "namespace": "",
  "name": "",
  "reconcileID": "0942417e-7ecb-437a-85db-adc553ccade9",
  "command-id": "b2b7c689-91ca-43c5-ac1c-2052bf7418c1",
  "reason": "empty"
}
{
  "level": "INFO",
  "time": "2025-03-02T07:25:56.783Z",
  "logger": "controller",
  "message": "tainted node",
  "commit": "058c665",
  "controller": "node.termination",
  "controllerGroup": "",
  "controllerKind": "Node",
  "Node": {
    "name": "ip-192-168-176-171.ap-northeast-2.compute.internal"
  },
  "namespace": "",
  "name": "ip-192-168-176-171.ap-northeast-2.compute.internal",
  "reconcileID": "6254e6be-2445-4402-b829-0bb75fa540e0",
  "taint.Key": "karpenter.sh/disrupted",
  "taint.Value": "",
  "taint.Effect": "NoSchedule"
}
{
  "level": "INFO",
  "time": "2025-03-02T07:26:49.195Z",
  "logger": "controller",
  "message": "deleted node",
  "commit": "058c665",
  "controller": "node.termination",
  "controllerGroup": "",
  "controllerKind": "Node",
  "Node": {
    "name": "ip-192-168-176-171.ap-northeast-2.compute.internal"
  },
  "namespace": "",
  "name": "ip-192-168-176-171.ap-northeast-2.compute.internal",
  "reconcileID": "6c126a63-8bfa-4828-8ef6-5d22b8c1e7cc"
}

#
kubectl get nodeclaims
> 2대로 줄어듬 확인
- Disruption (구 Consolidation) : Expiration , Drift , Consolidation
. Expiration (만료):
. 기본 720시간(30일) 후 인스턴스를 자동으로 만료하여 노드를 최신 상태로 유지
. Drift (드리프트):
. 구성 변경 사항(NodePool, EC2NodeClass)을 감지하여 필요한 변경 사항을 적용
. Consolidation (통합):
. 비용 효율적인 컴퓨팅 최적화 선택
. Karpenter는 클러스터의 컴퓨팅 자원을 지속적으로 최적화
. 스팟 인스턴스 시작:
. AWS EC2 Fleet Instance API를 호출, NodePool 구성에 맞는 인스턴스 유형 선택
. EC2 Fleet API는 시작된 인스턴스 목록과 시작할 수 없는 인스턴스 목록을 반환
ㄴ 시작할 수 없는 경우, 대체 용량을 요청하거나 soft 일정 제약 조건을 제거

. Spot-to-Spot Consolidation:
. 스팟 간 통합을 위해 최소 15개의 인스턴스 유형이 포함된 다양한 인스턴스 구성 필요
. 제약 조건이 없으면 가용성이 낮고 중단 빈도가 높은 인스턴스를 선택할 위험 있음
> 실습
# 기존 nodepool 삭제
kubectl delete nodepool,ec2nodeclass default

# 모니터링
kubectl logs -f -n "${KARPENTER_NAMESPACE}" -l app.kubernetes.io/name=karpenter -c controller | jq '.'
eks-node-viewer --resources cpu,memory --node-selector "karpenter.sh/registered=true" --extra-labels eks-node-viewer/node-age
watch -d "kubectl get nodes -L karpenter.sh/nodepool -L node.kubernetes.io/instance-type -L karpenter.sh/capacity-type"

# Create a Karpenter NodePool and EC2NodeClass
cat <<EOF | envsubst | kubectl apply -f -
apiVersion: karpenter.sh/v1
kind: NodePool
metadata:
  name: default
spec:
  template:
    spec:
      nodeClassRef:
        group: karpenter.k8s.aws
        kind: EC2NodeClass
        name: default
      requirements:
        - key: kubernetes.io/os
          operator: In
          values: ["linux"]
        - key: karpenter.sh/capacity-type
          operator: In
          values: ["on-demand"]
        - key: karpenter.k8s.aws/instance-category
          operator: In
          values: ["c", "m", "r"]
        - key: karpenter.k8s.aws/instance-size
          operator: NotIn
          values: ["nano","micro","small","medium"]
        - key: karpenter.k8s.aws/instance-hypervisor
          operator: In
          values: ["nitro"]
      expireAfter: 1h # nodes are terminated automatically after 1 hour
  limits:
    cpu: "1000"
    memory: 1000Gi
  disruption:
    consolidationPolicy: WhenEmptyOrUnderutilized # policy enables Karpenter to replace nodes when they are either empty or underutilized
    consolidateAfter: 1m
---
apiVersion: karpenter.k8s.aws/v1
kind: EC2NodeClass
metadata:
  name: default
spec:
  role: "KarpenterNodeRole-${CLUSTER_NAME}" # replace with your cluster name
  amiSelectorTerms:
    - alias: "al2023@latest"
  subnetSelectorTerms:
    - tags:
        karpenter.sh/discovery: "${CLUSTER_NAME}" # replace with your cluster name
  securityGroupSelectorTerms:
    - tags:
        karpenter.sh/discovery: "${CLUSTER_NAME}" # replace with your cluster name
EOF

# 확인
kubectl get nodepool,ec2nodeclass

# Deploy a sample workload
cat <<EOF | kubectl apply -f -
apiVersion: apps/v1
kind: Deployment
metadata:
  name: inflate
spec:
  replicas: 5
  selector:
    matchLabels:
      app: inflate
  template:
    metadata:
      labels:
        app: inflate
    spec:
      terminationGracePeriodSeconds: 0
      securityContext:
        runAsUser: 1000
        runAsGroup: 3000
        fsGroup: 2000
      containers:
      - name: inflate
        image: public.ecr.aws/eks-distro/kubernetes/pause:3.7
        resources:
          requests:
            cpu: 1
            memory: 1.5Gi
        securityContext:
          allowPrivilegeEscalation: false
EOF


#
kubectl get nodes -L karpenter.sh/nodepool -L node.kubernetes.io/instance-type -L karpenter.sh/capacity-type
kubectl get nodeclaims
kubectl describe nodeclaims
kubectl logs -f -n "${KARPENTER_NAMESPACE}" -l app.kubernetes.io/name=karpenter -c controller | jq '.'
kubectl logs -n "${KARPENTER_NAMESPACE}" -l app.kubernetes.io/name=karpenter -c controller | grep 'launched nodeclaim' | jq '.'


# Scale the inflate workload from 5 to 12 replicas, triggering Karpenter to provision additional capacity
kubectl scale deployment/inflate --replicas 12

# This changes the total memory request for this deployment to around 12Gi,
# which when adjusted to account for the roughly 600Mi reserved for the kubelet on each node means that this will fit on 2 instances of type m5.large:
kubectl get nodeclaims


# Scale down the workload back down to 5 replicas
kubectl scale deployment/inflate --replicas 5
kubectl get nodeclaims
NAME            TYPE          CAPACITY    ZONE              NODE                                                 READY   AGE
default-ffnzp   c6g.2xlarge   on-demand   ap-northeast-2c   ip-192-168-185-240.ap-northeast-2.compute.internal   True    14m


# We can check the Karpenter logs to get an idea of what actions it took in response to our scaling in the deployment. Wait about 5-10 seconds before running the following command:
kubectl logs -f -n "${KARPENTER_NAMESPACE}" -l app.kubernetes.io/name=karpenter -c controller | jq '.'
{
  "level": "INFO",
  "time": "2025-03-02T08:19:13.969Z",
  "logger": "controller",
  "message": "disrupting nodeclaim(s) via delete, terminating 1 nodes (5 pods) ip-192-168-132-48.ap-northeast-2.compute.internal/c6g.2xlarge/on-demand",
  "commit": "058c665",
  "controller": "disruption",
  "namespace": "",
  "name": "",
  "reconcileID": "a900df38-7189-42aa-a3b3-9fcaf944dcf4",
  "command-id": "4b7ef3a5-6962-48a9-bd38-c9898580bb75",
  "reason": "underutilized"
}


# Karpenter can also further consolidate if a node can be replaced with a cheaper variant in response to workload changes.
# This can be demonstrated by scaling the inflate deployment replicas down to 1, with a total memory request of around 1Gi:
kubectl scale deployment/inflate --replicas 1

kubectl logs -f -n "${KARPENTER_NAMESPACE}" -l app.kubernetes.io/name=karpenter -c controller | jq '.'
{
  "level": "INFO",
  "time": "2025-03-02T08:23:59.683Z",
  "logger": "controller",
  "message": "disrupting nodeclaim(s) via replace, terminating 1 nodes (1 pods) ip-192-168-185-240.ap-northeast-2.compute.internal/c6g.2xlarge/on-demand and replacing with on-demand node from types c6g.large, c7g.large, c5a.large, c6gd.large, m6g.large and 55 other(s)",
  "commit": "058c665",
  "controller": "disruption",
  "namespace": "",
  "name": "",
  "reconcileID": "6669c544-e065-4c97-b594-ec1fb68b68b5",
  "command-id": "b115c17f-3e29-48bc-8da8-d7073f189624",
  "reason": "underutilized"
}

kubectl get nodeclaims
NAME            TYPE          CAPACITY    ZONE              NODE                                                 READY   AGE
default-ff7xn   c6g.large     on-demand   ap-northeast-2b   ip-192-168-109-5.ap-northeast-2.compute.internal     True    78s
default-ffnzp   c6g.2xlarge   on-demand   ap-northeast-2c   ip-192-168-185-240.ap-northeast-2.compute.internal   True    16m

kubectl get nodeclaims
NAME            TYPE        CAPACITY    ZONE              NODE                                               READY   AGE
default-ff7xn   c6g.large   on-demand   ap-northeast-2b   ip-192-168-109-5.ap-northeast-2.compute.internal   True    3m3s


# 삭제
kubectl delete deployment inflate
kubectl delete nodepool,ec2nodeclass default


> 실습 리소스 삭제
# Karpenter helm 삭제
helm uninstall karpenter --namespace "${KARPENTER_NAMESPACE}"

# Karpenter IAM Role 등 생성한 CloudFormation 삭제
aws cloudformation delete-stack --stack-name "Karpenter-${CLUSTER_NAME}"

# EC2 Launch Template 삭제
aws ec2 describe-launch-templates --filters "Name=tag:karpenter.k8s.aws/cluster,Values=${CLUSTER_NAME}" |
    jq -r ".LaunchTemplates[].LaunchTemplateName" |
    xargs -I{} aws ec2 delete-launch-template --launch-template-name {}

# 클러스터 삭제
eksctl delete cluster --name "${CLUSTER_NAME}"'K8S - EKS' 카테고리의 다른 글
| 7주차 - EKS Mode/Nodes (0) | 2025.03.22 |
|---|---|
| 6주차 - EKS Security (0) | 2025.03.15 |
| 4주차 - EKS Observability (0) | 2025.02.28 |
| 3주차 - EKS Storage, Managed Node Groups (1) | 2025.02.22 |
| 2주차 - EKS Networking (0) | 2025.02.14 |


