고정 헤더 영역

상세 컨텐츠
본문
| 본 글은 CloudNet@ 팀 가시다님의 'AWS EKS Hands-on' 스터디를 내용을 기반으로 정리하였습니다. Kubernetes(이하 k8s)에 대한 지식(아키텍처, 사용법 등)이 있다고 가정하고 작성했습니다. 잘못된 정보가 있으면 언제든지 알려주시기 바랍니다. |
목차
| 0. 실습 환경 배포 1. 배경 설명 2. EKS Console 3. Logging in EKS 4. Container Insights metrics in Amazon CloudWatch & Fluent Bit (Logs) 5. Metrics-server & kwatch & botkube 6. 프로메테우스-스택 7. 그라파나 Grafana 8. 그라파나 얼럿 Alert 9. OpenTelemetry (OTel) |
0. 실습 환경 배포
- 원클릭 실습 환경 배포
. 사전 준비 : AWS 계정, SSH 키 페어, IAM 계정 - 키

- VPC (2개)
. 운영 서버용 (operator-vpc) - 2개 (Public Subnet 1개, Private Subnet 1개)
. EKS 배포 VPC (myeks-vpc) - 6개 (Public Subnet 3개, Private Subnet 3개)
- 로드밸런서 배포를 위한 퍼블릭/프라이빗 서브넷에 태그 설정 - Docs
- VPC Peering
. 운영 VPC - EKS 간 내부 통신용
- EC2 - 4대 (EKS 워커노드 3대 - t3.xlarge, 운영 서버 1대)
. 운영서버 : operator-vpc AZ1을 사용하는 퍼블릭 서브넷에 기동 (172.20.1.100)
- EFS 스토리지
. 3개의 퍼블릭 서브넷에 네트워크 인터페이스 연동
> 실습 환경 배포
더보기
> 파라미터 값
- 아래 빨간색 부분은 설정해주는어야 할 것, 그외 부분은 기본값 사용을 권장
- <<<<< Deploy EC2 >>>>>
- KeyName : 운영서버 ec2에 SSH 접속을 위한 SSH 키페어 이름 지정 ← 미리 SSH 키 생성 해두자!
- MyIamUserAccessKeyID : 관리자 수준의 권한을 가진 IAM User의 액세스 키ID 입력
- MyIamUserSecretAccessKey : 관리자 수준의 권한을 가진 IAM User의 시크릿 키ID 입력 ← 노출되지 않게 보안 주의
- SgIngressSshCidr : 운영서버 ec2에 SSH 접속 가능한 IP 입력 (집 공인IP/32 입력), 보안그룹 인바운드 규칙에 반영됨
- MyInstanceType: 운영서버 EC2 인스턴스의 타입 (기본 t3.small) ⇒ 변경 가능
- LatestAmiId : 운영서버 EC2에 사용할 AMI는 아마존리눅스2 최신 버전 사용
- <<<<< EKS Config >>>>>
- ClusterBaseName : EKS 클러스터 이름이며, myeks 기본값 사용을 권장 → 이유: 실습 리소스 태그명과 실습 커멘드에서 사용
- KubernetesVersion : EKS 호환, 쿠버네티스 버전 (기본 v1.31, 실습은 1.31 버전 사용) ⇒ 변경 가능
- WorkerNodeInstanceType: 워커 노드 EC2 인스턴스의 타입 (기본 t3.medium) ⇒ 변경 가능
- WorkerNodeCount : 워커노드의 갯수를 입력 (기본 3대) ⇒ 변경 가능
- WorkerNodeVolumesize : 워커노드의 EBS 볼륨 크기 (기본 60GiB) ⇒ 변경 가능
- <<<<< Region AZ >>>>> : 리전과 가용영역을 지정, 기본값 그대로 사용
- <<<<< Deploy EC2 >>>>>
# YAML 파일 다운로드
curl -O https://s3.ap-northeast-2.amazonaws.com/cloudformation.cloudneta.net/K8S/myeks-4week.yaml

# 변수 지정
CLUSTER_NAME=myeks
SSHKEYNAME=<SSH 키 페이 이름>
MYACCESSKEY=<IAM Uesr 액세스 키>
MYSECRETKEY=<IAM Uesr 시크릿 키>
WorkerNodeInstanceType=<워커 노드 인스턴스 타입> # 워커노드 인스턴스 타입 변경 가능

# CloudFormation 스택 배포
aws cloudformation deploy --template-file myeks-4week.yaml --stack-name $CLUSTER_NAME --parameter-overrides KeyName=$SSHKEYNAME SgIngressSshCidr=$(curl -s ipinfo.io/ip)/32  MyIamUserAccessKeyID=$MYACCESSKEY MyIamUserSecretAccessKey=$MYSECRETKEY ClusterBaseName=$CLUSTER_NAME WorkerNodeInstanceType=$WorkerNodeInstanceType --region ap-northeast-2

# CloudFormation 스택 배포 완료 후 작업용 EC2 IP 출력
aws cloudformation describe-stacks --stack-name myeks --query 'Stacks[*].Outputs[0].OutputValue' --output text
> 배포 과정 확인
더보기
# 운영서버 EC2 SSH 접속
ssh -i <SSH 키 파일 위치> ec2-user@$(aws cloudformation describe-stacks --stack-name myeks --query 'Stacks[*].Outputs[0].OutputValue' --output text)
ssh -i ~/.ssh/kp-gasida.pem ec2-user@$(aws cloudformation describe-stacks --stack-name myeks --query 'Stacks[*].Outputs[0].OutputValue' --output text)
-------------------------------------------------
#
whoami
pwd

# cloud-init 실행 과정 로그 확인
tail -f /var/log/cloud-init-output.log

# eks 설정 파일 확인
cat myeks.yaml

# cloud-init 정상 완료 후 eksctl 실행 과정 로그 확인
tail -f /root/create-eks.log

#
exit
-------------------------------------------------
> 실습 환경 배포 yaml
더보기
AWSTemplateFormatVersion: '2010-09-09'

Metadata:
  AWS::CloudFormation::Interface:
    ParameterGroups:
      - Label:
          default: "<<<<< Deploy EC2 >>>>>"
        Parameters:
          - KeyName
          - MyIamUserAccessKeyID
          - MyIamUserSecretAccessKey
          - SgIngressSshCidr
          - MyInstanceType
          - LatestAmiId

      - Label:
          default: "<<<<< EKS Config >>>>>"
        Parameters:
          - ClusterBaseName
          - KubernetesVersion
          - WorkerNodeInstanceType
          - WorkerNodeCount
          - WorkerNodeVolumesize

Parameters:
  KeyName:
    Description: Name of an existing EC2 KeyPair to enable SSH access to the instances. Linked to AWS Parameter
    Type: AWS::EC2::KeyPair::KeyName
    ConstraintDescription: must be the name of an existing EC2 KeyPair.

  MyIamUserAccessKeyID:
    Description: IAM User - AWS Access Key ID (won't be echoed)
    Type: String
    NoEcho: true

  MyIamUserSecretAccessKey:
    Description: IAM User - AWS Secret Access Key (won't be echoed)
    Type: String
    NoEcho: true

  SgIngressSshCidr:
    Description: The IP address range that can be used to communicate to the EC2 instances
    Type: String
    MinLength: '9'
    MaxLength: '18'
    Default: 0.0.0.0/0
    AllowedPattern: (\d{1,3})\.(\d{1,3})\.(\d{1,3})\.(\d{1,3})/(\d{1,2})
    ConstraintDescription: must be a valid IP CIDR range of the form x.x.x.x/x.

  MyInstanceType:
    Description: Enter t2.micro, t2.small, t2.medium, t3.micro, t3.small, t3.medium. Default is t2.micro.
    Type: String
    Default: t3.small
    AllowedValues:
      - t2.micro
      - t2.small
      - t2.medium
      - t3.micro
      - t3.small
      - t3.medium

  LatestAmiId:
    Description: (DO NOT CHANGE)
    Type: 'AWS::SSM::Parameter::Value<AWS::EC2::Image::Id>'
    Default: '/aws/service/ami-amazon-linux-latest/amzn2-ami-hvm-x86_64-gp2'
    AllowedValues:
      - /aws/service/ami-amazon-linux-latest/amzn2-ami-hvm-x86_64-gp2

  ClusterBaseName:
    Type: String
    Default: myeks
    AllowedPattern: "[a-zA-Z][-a-zA-Z0-9]*"
    Description: must be a valid Allowed Pattern '[a-zA-Z][-a-zA-Z0-9]*'
    ConstraintDescription: ClusterBaseName - must be a valid Allowed Pattern

  KubernetesVersion:
    Description: Enter Kubernetes Version, 1.23 ~ 1.26
    Type: String
    Default: 1.31

  WorkerNodeInstanceType:
    Description: Enter EC2 Instance Type. Default is t3.medium.
    Type: String
    Default: t3.medium

  WorkerNodeCount:
    Description: Worker Node Counts
    Type: String
    Default: 3

  WorkerNodeVolumesize:
    Description: Worker Node Volumes size
    Type: String
    Default: 60

  OperatorBaseName:
    Type: String
    Default: operator
    AllowedPattern: "[a-zA-Z][-a-zA-Z0-9]*"
    Description: must be a valid Allowed Pattern '[a-zA-Z][-a-zA-Z0-9]*'
    ConstraintDescription: operator - must be a valid Allowed Pattern

  TargetRegion:
    Type: String
    Default: ap-northeast-2
  AvailabilityZone1:
    Type: String
    Default: ap-northeast-2a
  AvailabilityZone2:
    Type: String
    Default: ap-northeast-2b
  AvailabilityZone3:
    Type: String
    Default: ap-northeast-2c

  Vpc1Block:
    Type: String
    Default: 192.168.0.0/16
  Vpc1PublicSubnet1Block:
    Type: String
    Default: 192.168.1.0/24
  Vpc1PublicSubnet2Block:
    Type: String
    Default: 192.168.2.0/24
  Vpc1PublicSubnet3Block:
    Type: String
    Default: 192.168.3.0/24
  Vpc1PrivateSubnet1Block:
    Type: String
    Default: 192.168.11.0/24
  Vpc1PrivateSubnet2Block:
    Type: String
    Default: 192.168.12.0/24
  Vpc1PrivateSubnet3Block:
    Type: String
    Default: 192.168.13.0/24


  Vpc2Block:
    Type: String
    Default: 172.20.0.0/16
  Vpc2PublicSubnet1Block:
    Type: String
    Default: 172.20.1.0/24
  Vpc2PrivateSubnet1Block:
    Type: String
    Default: 172.20.11.0/24


Resources:
# VPC1
  EksVPC:
    Type: AWS::EC2::VPC
    Properties:
      CidrBlock: !Ref Vpc1Block
      EnableDnsSupport: true
      EnableDnsHostnames: true
      Tags:
        - Key: Name
          Value: !Sub ${ClusterBaseName}-VPC

# Vpc1PublicSubnets
  Vpc1PublicSubnet1:
    Type: AWS::EC2::Subnet
    Properties:
      AvailabilityZone: !Ref AvailabilityZone1
      CidrBlock: !Ref Vpc1PublicSubnet1Block
      VpcId: !Ref EksVPC
      MapPublicIpOnLaunch: true
      Tags:
        - Key: Name
          Value: !Sub ${ClusterBaseName}-Vpc1PublicSubnet1
        - Key: kubernetes.io/role/elb
          Value: 1

  Vpc1PublicSubnet2:
    Type: AWS::EC2::Subnet
    Properties:
      AvailabilityZone: !Ref AvailabilityZone2
      CidrBlock: !Ref Vpc1PublicSubnet2Block
      VpcId: !Ref EksVPC
      MapPublicIpOnLaunch: true
      Tags:
        - Key: Name
          Value: !Sub ${ClusterBaseName}-Vpc1PublicSubnet2
        - Key: kubernetes.io/role/elb
          Value: 1

  Vpc1PublicSubnet3:
    Type: AWS::EC2::Subnet
    Properties:
      AvailabilityZone: !Ref AvailabilityZone3
      CidrBlock: !Ref Vpc1PublicSubnet3Block
      VpcId: !Ref EksVPC
      MapPublicIpOnLaunch: true
      Tags:
        - Key: Name
          Value: !Sub ${ClusterBaseName}-Vpc1PublicSubnet3
        - Key: kubernetes.io/role/elb
          Value: 1

  Vpc1InternetGateway:
    Type: AWS::EC2::InternetGateway

  Vpc1GatewayAttachment:
    Type: AWS::EC2::VPCGatewayAttachment
    Properties:
      InternetGatewayId: !Ref Vpc1InternetGateway
      VpcId: !Ref EksVPC

  Vpc1PublicSubnetRouteTable:
    Type: AWS::EC2::RouteTable
    Properties:
      VpcId: !Ref EksVPC
      Tags:
        - Key: Name
          Value: !Sub ${ClusterBaseName}-Vpc1PublicSubnetRouteTable

  Vpc1PublicSubnetRoute:
    Type: AWS::EC2::Route
    Properties:
      RouteTableId: !Ref Vpc1PublicSubnetRouteTable
      DestinationCidrBlock: 0.0.0.0/0
      GatewayId: !Ref Vpc1InternetGateway

  Vpc1PublicSubnet1RouteTableAssociation:
    Type: AWS::EC2::SubnetRouteTableAssociation
    Properties:
      SubnetId: !Ref Vpc1PublicSubnet1
      RouteTableId: !Ref Vpc1PublicSubnetRouteTable

  Vpc1PublicSubnet2RouteTableAssociation:
    Type: AWS::EC2::SubnetRouteTableAssociation
    Properties:
      SubnetId: !Ref Vpc1PublicSubnet2
      RouteTableId: !Ref Vpc1PublicSubnetRouteTable

  Vpc1PublicSubnet3RouteTableAssociation:
    Type: AWS::EC2::SubnetRouteTableAssociation
    Properties:
      SubnetId: !Ref Vpc1PublicSubnet3
      RouteTableId: !Ref Vpc1PublicSubnetRouteTable

# Vpc1PrivateSubnets
  Vpc1PrivateSubnet1:
    Type: AWS::EC2::Subnet
    Properties:
      AvailabilityZone: !Ref AvailabilityZone1
      CidrBlock: !Ref Vpc1PrivateSubnet1Block
      VpcId: !Ref EksVPC
      Tags:
        - Key: Name
          Value: !Sub ${ClusterBaseName}-Vpc1PrivateSubnet1
        - Key: kubernetes.io/role/internal-elb
          Value: 1

  Vpc1PrivateSubnet2:
    Type: AWS::EC2::Subnet
    Properties:
      AvailabilityZone: !Ref AvailabilityZone2
      CidrBlock: !Ref Vpc1PrivateSubnet2Block
      VpcId: !Ref EksVPC
      Tags:
        - Key: Name
          Value: !Sub ${ClusterBaseName}-Vpc1PrivateSubnet2
        - Key: kubernetes.io/role/internal-elb
          Value: 1

  Vpc1PrivateSubnet3:
    Type: AWS::EC2::Subnet
    Properties:
      AvailabilityZone: !Ref AvailabilityZone3
      CidrBlock: !Ref Vpc1PrivateSubnet3Block
      VpcId: !Ref EksVPC
      Tags:
        - Key: Name
          Value: !Sub ${ClusterBaseName}-Vpc1PrivateSubnet3
        - Key: kubernetes.io/role/internal-elb
          Value: 1

  Vpc1PrivateSubnetRouteTable:
    Type: AWS::EC2::RouteTable
    Properties:
      VpcId: !Ref EksVPC
      Tags:
        - Key: Name
          Value: !Sub ${ClusterBaseName}-Vpc1PrivateSubnetRouteTable

  Vpc1PrivateSubnet1RouteTableAssociation:
    Type: AWS::EC2::SubnetRouteTableAssociation
    Properties:
      SubnetId: !Ref Vpc1PrivateSubnet1
      RouteTableId: !Ref Vpc1PrivateSubnetRouteTable

  Vpc1PrivateSubnet2RouteTableAssociation:
    Type: AWS::EC2::SubnetRouteTableAssociation
    Properties:
      SubnetId: !Ref Vpc1PrivateSubnet2
      RouteTableId: !Ref Vpc1PrivateSubnetRouteTable

  Vpc1PrivateSubnet3RouteTableAssociation:
    Type: AWS::EC2::SubnetRouteTableAssociation
    Properties:
      SubnetId: !Ref Vpc1PrivateSubnet3
      RouteTableId: !Ref Vpc1PrivateSubnetRouteTable

# VPC2
  OpsVPC:
    Type: AWS::EC2::VPC
    Properties:
      CidrBlock: !Ref Vpc2Block
      EnableDnsSupport: true
      EnableDnsHostnames: true
      Tags:
        - Key: Name
          Value: !Sub ${OperatorBaseName}-VPC

# Vpc2PublicSubnets
  Vpc2PublicSubnet1:
    Type: AWS::EC2::Subnet
    Properties:
      AvailabilityZone: !Ref AvailabilityZone1
      CidrBlock: !Ref Vpc2PublicSubnet1Block
      VpcId: !Ref OpsVPC
      MapPublicIpOnLaunch: true
      Tags:
        - Key: Name
          Value: !Sub ${OperatorBaseName}-Vpc2PublicSubnet1

  Vpc2InternetGateway:
    Type: AWS::EC2::InternetGateway

  Vpc2GatewayAttachment:
    Type: AWS::EC2::VPCGatewayAttachment
    Properties:
      InternetGatewayId: !Ref Vpc2InternetGateway
      VpcId: !Ref OpsVPC

  Vpc2PublicSubnetRouteTable:
    Type: AWS::EC2::RouteTable
    Properties:
      VpcId: !Ref OpsVPC
      Tags:
        - Key: Name
          Value: !Sub ${OperatorBaseName}-Vpc2PublicSubnetRouteTable

  Vpc2PublicSubnetRoute:
    Type: AWS::EC2::Route
    Properties:
      RouteTableId: !Ref Vpc2PublicSubnetRouteTable
      DestinationCidrBlock: 0.0.0.0/0
      GatewayId: !Ref Vpc2InternetGateway

  Vpc2PublicSubnet1RouteTableAssociation:
    Type: AWS::EC2::SubnetRouteTableAssociation
    Properties:
      SubnetId: !Ref Vpc2PublicSubnet1
      RouteTableId: !Ref Vpc2PublicSubnetRouteTable


# Vpc2PrivateSubnets
  Vpc2PrivateSubnet1:
    Type: AWS::EC2::Subnet
    Properties:
      AvailabilityZone: !Ref AvailabilityZone1
      CidrBlock: !Ref Vpc2PrivateSubnet1Block
      VpcId: !Ref OpsVPC
      Tags:
        - Key: Name
          Value: !Sub ${OperatorBaseName}-Vpc2PrivateSubnet1

  Vpc2PrivateSubnetRouteTable:
    Type: AWS::EC2::RouteTable
    Properties:
      VpcId: !Ref OpsVPC
      Tags:
        - Key: Name
          Value: !Sub ${OperatorBaseName}-Vpc2PrivateSubnetRouteTable

  Vpc2PrivateSubnet1RouteTableAssociation:
    Type: AWS::EC2::SubnetRouteTableAssociation
    Properties:
      SubnetId: !Ref Vpc2PrivateSubnet1
      RouteTableId: !Ref Vpc2PrivateSubnetRouteTable

# VPC Peering
  VPCPeering:
    Type: AWS::EC2::VPCPeeringConnection
    Properties:
      VpcId: !Ref EksVPC
      PeerVpcId: !Ref OpsVPC
      Tags:
      - Key: Name
        Value: VPCPeering-EksVPC-OpsVPC

  PeeringRoute1:
    Type: AWS::EC2::Route
    Properties:
      DestinationCidrBlock: 172.20.0.0/16
      RouteTableId: !Ref Vpc1PublicSubnetRouteTable
      VpcPeeringConnectionId: !Ref VPCPeering

  PeeringRoute2:
    Type: AWS::EC2::Route
    Properties:
      DestinationCidrBlock: 192.168.0.0/16
      RouteTableId: !Ref Vpc2PublicSubnetRouteTable
      VpcPeeringConnectionId: !Ref VPCPeering


# EFS
  EFSSG:
    Type: AWS::EC2::SecurityGroup
    Properties:
      VpcId: !Ref EksVPC
      GroupDescription: EFS Security Group
      Tags:
      - Key : Name
        Value : !Sub ${ClusterBaseName}-EFS
      SecurityGroupIngress:
      - IpProtocol: tcp
        FromPort: '2049'
        ToPort: '2049'
        CidrIp: !Ref Vpc1Block
      - IpProtocol: tcp
        FromPort: '2049'
        ToPort: '2049'
        CidrIp: 172.20.1.100/32

  ElasticFileSystem:
    Type: AWS::EFS::FileSystem
    Properties:
      FileSystemTags:
        - Key: Name
          Value: !Sub ${ClusterBaseName}-EFS

  ElasticFileSystemMountTarget0:
    Type: AWS::EFS::MountTarget
    Properties:
      FileSystemId: !Ref ElasticFileSystem
      SecurityGroups:
      - !Ref EFSSG
      SubnetId: !Ref Vpc1PublicSubnet1
  ElasticFileSystemMountTarget1:
    Type: AWS::EFS::MountTarget
    Properties:
      FileSystemId: !Ref ElasticFileSystem
      SecurityGroups:
      - !Ref EFSSG
      SubnetId: !Ref Vpc1PublicSubnet2
  ElasticFileSystemMountTarget2:
    Type: AWS::EFS::MountTarget
    Properties:
      FileSystemId: !Ref ElasticFileSystem
      SecurityGroups:
      - !Ref EFSSG
      SubnetId: !Ref Vpc1PublicSubnet3


# OPS-Host
  OPSSG:
    Type: AWS::EC2::SecurityGroup
    Properties:
      GroupDescription: Operator-host Security Group
      VpcId: !Ref OpsVPC
      Tags:
        - Key: Name
          Value: !Sub ${OperatorBaseName}-HOST-SG
      SecurityGroupIngress:
      - IpProtocol: '-1'
        CidrIp: !Ref SgIngressSshCidr
      - IpProtocol: '-1'
        CidrIp: 192.168.0.0/16

  OPSEC2:
    Type: AWS::EC2::Instance
    Properties:
      InstanceType: !Ref MyInstanceType
      ImageId: !Ref LatestAmiId
      KeyName: !Ref KeyName
      Tags:
        - Key: Name
          Value: !Sub ${OperatorBaseName}-host
      NetworkInterfaces:
        - DeviceIndex: 0
          SubnetId: !Ref Vpc2PublicSubnet1
          GroupSet:
          - !Ref OPSSG
          AssociatePublicIpAddress: true
          PrivateIpAddress: 172.20.1.100
      BlockDeviceMappings:
        - DeviceName: /dev/xvda
          Ebs:
            VolumeType: gp3
            VolumeSize: 30
            DeleteOnTermination: true
      UserData:
        Fn::Base64:
          !Sub |
            #!/bin/bash
            hostnamectl --static set-hostname "${OperatorBaseName}-host"

            # Config convenience
            echo 'alias vi=vim' >> /etc/profile
            echo "sudo su -" >> /home/ec2-user/.bashrc
            sed -i "s/UTC/Asia\/Seoul/g" /etc/sysconfig/clock
            ln -sf /usr/share/zoneinfo/Asia/Seoul /etc/localtime

            # Install Packages
            yum -y install tree jq git htop amazon-efs-utils

            # Install kubectl & helm
            cd /root
            curl -O https://s3.us-west-2.amazonaws.com/amazon-eks/1.31.2/2024-11-15/bin/linux/amd64/kubectl
            install -o root -g root -m 0755 kubectl /usr/local/bin/kubectl
            curl -s https://raw.githubusercontent.com/helm/helm/master/scripts/get-helm-3 | bash

            # Install eksctl
            curl -sL "https://github.com/eksctl-io/eksctl/releases/latest/download/eksctl_Linux_amd64.tar.gz" | tar xz -C /tmp
            mv /tmp/eksctl /usr/local/bin

            # Install aws cli v2
            curl "https://awscli.amazonaws.com/awscli-exe-linux-x86_64.zip" -o "awscliv2.zip"
            unzip awscliv2.zip >/dev/null 2>&1
            ./aws/install
            complete -C '/usr/local/bin/aws_completer' aws
            echo 'export AWS_PAGER=""' >>/etc/profile

            # Install kube-ps1
            echo 'source <(kubectl completion bash)' >> /root/.bashrc
            echo 'alias k=kubectl' >> /root/.bashrc
            echo 'complete -F __start_kubectl k' >> /root/.bashrc

            git clone https://github.com/jonmosco/kube-ps1.git /root/kube-ps1
            cat <<"EOT" >> /root/.bashrc
            source /root/kube-ps1/kube-ps1.sh
            KUBE_PS1_SYMBOL_ENABLE=false
            function get_cluster_short() {
              echo "$1" | cut -d . -f1
            }
            KUBE_PS1_CLUSTER_FUNCTION=get_cluster_short
            KUBE_PS1_SUFFIX=') '
            PS1='$(kube_ps1)'$PS1
            EOT

            # IAM User Credentials
            export AWS_ACCESS_KEY_ID=${MyIamUserAccessKeyID}
            export AWS_SECRET_ACCESS_KEY=${MyIamUserSecretAccessKey}
            export AWS_DEFAULT_REGION=${AWS::Region}
            export ACCOUNT_ID=$(aws sts get-caller-identity --query 'Account' --output text)
            export SSHKEYNAME=${KeyName}
            echo "export AWS_ACCESS_KEY_ID=$AWS_ACCESS_KEY_ID" >> /etc/profile
            echo "export AWS_SECRET_ACCESS_KEY=$AWS_SECRET_ACCESS_KEY" >> /etc/profile
            echo "export AWS_DEFAULT_REGION=$AWS_DEFAULT_REGION" >> /etc/profile
            echo "export ACCOUNT_ID=$(aws sts get-caller-identity --query 'Account' --output text)" >> /etc/profile
            echo "export SSHKEYNAME=${KeyName}" >> /etc/profile

            # CLUSTER_NAME
            export CLUSTER_NAME=${ClusterBaseName}
            echo "export CLUSTER_NAME=$CLUSTER_NAME" >> /etc/profile

            # K8S Version
            export KUBERNETES_VERSION=${KubernetesVersion}
            echo "export KUBERNETES_VERSION=$KUBERNETES_VERSION" >> /etc/profile

            # VPC & Subnet
            export VPCID=$(aws ec2 describe-vpcs --filters "Name=tag:Name,Values=$CLUSTER_NAME-VPC" --query 'Vpcs[*].VpcId' --output text)
            echo "export VPCID=$VPCID" >> /etc/profile
            export PubSubnet1=$(aws ec2 describe-subnets --filters Name=tag:Name,Values="$CLUSTER_NAME-Vpc1PublicSubnet1" --query "Subnets[0].[SubnetId]" --output text)
            export PubSubnet2=$(aws ec2 describe-subnets --filters Name=tag:Name,Values="$CLUSTER_NAME-Vpc1PublicSubnet2" --query "Subnets[0].[SubnetId]" --output text)
            export PubSubnet3=$(aws ec2 describe-subnets --filters Name=tag:Name,Values="$CLUSTER_NAME-Vpc1PublicSubnet3" --query "Subnets[0].[SubnetId]" --output text)
            echo "export PubSubnet1=$PubSubnet1" >> /etc/profile
            echo "export PubSubnet2=$PubSubnet2" >> /etc/profile
            echo "export PubSubnet3=$PubSubnet3" >> /etc/profile

            # Create EKS Cluster & Nodegroup
            cat << EOF > $CLUSTER_NAME.yaml
            apiVersion: eksctl.io/v1alpha5
            kind: ClusterConfig
            metadata:
              name: $CLUSTER_NAME
              region: $AWS_DEFAULT_REGION
              version: "$KUBERNETES_VERSION"

            iam:
              withOIDC: true

              serviceAccounts:
              - metadata:
                  name: aws-load-balancer-controller
                  namespace: kube-system
                wellKnownPolicies:
                  awsLoadBalancerController: true

            vpc:
              cidr: ${Vpc1Block}
              clusterEndpoints:
                privateAccess: true
                publicAccess: true
              id: $VPCID
              subnets:
                public:
                  ap-northeast-2a:
                    az: ap-northeast-2a
                    cidr: ${Vpc1PublicSubnet1Block}
                    id: $PubSubnet1
                  ap-northeast-2b:
                    az: ap-northeast-2b
                    cidr: ${Vpc1PublicSubnet2Block}
                    id: $PubSubnet2
                  ap-northeast-2c:
                    az: ap-northeast-2c
                    cidr: ${Vpc1PublicSubnet3Block}
                    id: $PubSubnet3

            addons:
              - name: vpc-cni # no version is specified so it deploys the default version
                version: latest # auto discovers the latest available
                attachPolicyARNs: # attach IAM policies to the add-on's service account
                  - arn:aws:iam::aws:policy/AmazonEKS_CNI_Policy
                configurationValues: |-
                  enableNetworkPolicy: "true"

              - name: kube-proxy
                version: latest

              - name: coredns
                version: latest

              - name: metrics-server
                version: latest

              - name: aws-ebs-csi-driver
                version: latest
                wellKnownPolicies:
                  ebsCSIController: true

            managedNodeGroups:
            - amiFamily: AmazonLinux2023
              desiredCapacity: ${WorkerNodeCount}
              iam:
                withAddonPolicies:
                  certManager: true
                  externalDNS: true
              instanceType: ${WorkerNodeInstanceType}
              preBootstrapCommands:
                # install additional packages
                - "dnf install nvme-cli links tree tcpdump sysstat ipvsadm ipset bind-utils htop -y"
              labels:
                alpha.eksctl.io/cluster-name: $CLUSTER_NAME
                alpha.eksctl.io/nodegroup-name: ng1
              maxPodsPerNode: 60
              maxSize: 3
              minSize: 3
              name: ng1
              ssh:
                allow: true
                publicKeyName: $SSHKEYNAME
              tags:
                alpha.eksctl.io/nodegroup-name: ng1
                alpha.eksctl.io/nodegroup-type: managed
              volumeIOPS: 3000
              volumeSize: ${WorkerNodeVolumesize}
              volumeThroughput: 125
              volumeType: gp3
            EOF
            nohup eksctl create cluster -f $CLUSTER_NAME.yaml --install-nvidia-plugin=false --verbose 4 --kubeconfig "/root/.kube/config" 1> /root/create-eks.log 2>&1 &

            # Install krew
            curl -L https://github.com/kubernetes-sigs/krew/releases/download/v0.4.4/krew-linux_amd64.tar.gz -o /root/krew-linux_amd64.tar.gz
            tar zxvf krew-linux_amd64.tar.gz
            ./krew-linux_amd64 install krew
            export PATH="$PATH:/root/.krew/bin"
            echo 'export PATH="$PATH:/root/.krew/bin"' >> /etc/profile

            # Install krew plugin
            kubectl krew install ctx ns get-all neat df-pv stern oomd view-secret # ktop tree

            # Install Docker & Docker-compose
            amazon-linux-extras install docker -y
            systemctl start docker && systemctl enable docker
            curl -L "https://github.com/docker/compose/releases/latest/download/docker-compose-$(uname -s)-$(uname -m)" -o /usr/local/bin/docker-compose
            chmod +x /usr/local/bin/docker-compose

            # Install Kubecolor
            wget https://github.com/kubecolor/kubecolor/releases/download/v0.5.0/kubecolor_0.5.0_linux_amd64.tar.gz
            tar -zxvf kubecolor_0.5.0_linux_amd64.tar.gz
            mv kubecolor /usr/local/bin/

            # Install Kind
            curl -Lo ./kind https://kind.sigs.k8s.io/dl/v0.27.0/kind-linux-amd64
            chmod +x ./kind
            mv ./kind /usr/local/bin/kind

            echo 'Userdata End!'

Outputs:
  eksctlhost:
    Value: !GetAtt OPSEC2.PublicIp
> 배포되는 myeks.yaml파일 및 nvidia-device-plugin-daemonset
cat << EOF > myeks.yaml
apiVersion: eksctl.io/v1alpha5
kind: ClusterConfig
metadata:
  name: myeks
  region: ap-northeast-2
  version: "1.31"

iam:
  withOIDC: true # enables the IAM OIDC provider as well as IRSA for the Amazon CNI plugin

  serviceAccounts: # service accounts to create in the cluster. See IAM Service Accounts
  - metadata:
      name: aws-load-balancer-controller
      namespace: kube-system
    wellKnownPolicies:
      awsLoadBalancerController: true

vpc:
  cidr: 192.168.0.0/16
  clusterEndpoints:
    privateAccess: true # if you only want to allow private access to the cluster
    publicAccess: true # if you want to allow public access to the cluster
  id: $VPCID
  subnets:
    public:
      ap-northeast-2a:
        az: ap-northeast-2a
        cidr: 192.168.1.0/24
        id: $PubSubnet1
      ap-northeast-2b:
        az: ap-northeast-2b
        cidr: 192.168.2.0/24
        id: $PubSubnet2
      ap-northeast-2c:
        az: ap-northeast-2c
        cidr: 192.168.3.0/24
        id: $PubSubnet3

addons:
  - name: vpc-cni # no version is specified so it deploys the default version
    version: latest # auto discovers the latest available
    attachPolicyARNs: # attach IAM policies to the add-on's service account
      - arn:aws:iam::aws:policy/AmazonEKS_CNI_Policy
    configurationValues: |-
      enableNetworkPolicy: "true"

  - name: kube-proxy
    version: latest

  - name: coredns
    version: latest

  - name: metrics-server
    version: latest

  - name: aws-ebs-csi-driver
    version: latest
    wellKnownPolicies:
      ebsCSIController: true

managedNodeGroups:
- amiFamily: AmazonLinux2023
  desiredCapacity: 3
  iam:
    withAddonPolicies:
      certManager: true # Enable cert-manager
      externalDNS: true # Enable ExternalDNS
  instanceType: t3.xlarge
  preBootstrapCommands:
    # install additional packages
    - "dnf install nvme-cli links tree tcpdump sysstat ipvsadm ipset bind-utils htop -y"
  labels:
    alpha.eksctl.io/cluster-name: myeks
    alpha.eksctl.io/nodegroup-name: ng1
  maxPodsPerNode: 60
  maxSize: 3
  minSize: 3
  name: ng1
  ssh:
    allow: true
    publicKeyName: $SSHKEYNAME
  tags:
    alpha.eksctl.io/nodegroup-name: ng1
    alpha.eksctl.io/nodegroup-type: managed
  volumeIOPS: 3000
  volumeSize: 100
  volumeThroughput: 125
  volumeType: gp3
EOF
> t3.xlarge 관리노드 기본 설정 '--install-nvidia-plugin' 배포 시
# --install-nvidia-plugin 은 노드그룹 옵션에는 없고, 클러스터 생성 옵션에만 있음
eksctl create cluster --help | grep -i nvidia
      --install-nvidia-plugin       install Nvidia plugin for GPU nodes (default true)

#
kubectl get ds -n kube-system nvidia-device-plugin-daemonset
NAME                             DESIRED   CURRENT   READY   UP-TO-DATE   AVAILABLE   NODE SELECTOR   AGE
nvidia-device-plugin-daemonset   3         3         3       3            3           <none>          79m

kubectl get pod -n kube-system -l name=nvidia-device-plugin-ds
NAME                                   READY   STATUS    RESTARTS      AGE
nvidia-device-plugin-daemonset-bzwqr   1/1     Running   2 (48m ago)   80m
nvidia-device-plugin-daemonset-dw8sb   1/1     Running   0             80m
nvidia-device-plugin-daemonset-vfvvt   1/1     Running   0             80m
> 내 PC에서 AWS EKS 설치 확인 - 스택 생성 시작 후 충분한 시간 (약 20분) 후 접속
. kubeconfig 업데이트
# 변수 지정
CLUSTER_NAME=myeks
SSHKEYNAME=$(본인 key 이름)

#
eksctl get cluster
eksctl get nodegroup --cluster $CLUSTER_NAME
eksctl get addon --cluster $CLUSTER_NAME
eksctl get iamserviceaccount --cluster $CLUSTER_NAME

# kubeconfig 생성
aws sts get-caller-identity --query Arn
aws eks update-kubeconfig --name myeks --user-alias <위 출력된 자격증명 사용자>
aws eks update-kubeconfig --name myeks --user-alias admin

#
kubectl cluster-info
kubectl ns default
kubectl get node -v6
kubectl get node --label-columns=node.kubernetes.io/instance-type,eks.amazonaws.com/capacityType,topology.kubernetes.io/zone
kubectl get pod -A
kubectl get pdb -n kube-system

# krew 플러그인 확인
kubectl krew list
kubectl get-all
> AWS 관리 콘솔 확인

> 노드 IP 정보 확인 및 SSH 접속 확인
# 인스턴스 정보 확인
aws ec2 describe-instances --query "Reservations[*].Instances[*].{InstanceID:InstanceId, PublicIPAdd:PublicIpAddress, PrivateIPAdd:PrivateIpAddress, InstanceName:Tags[?Key=='Name']|[0].Value, Status:State.Name}" --filters Name=instance-state-name,Values=running --output table

# EC2 공인 IP 변수 지정
export N1=$(aws ec2 describe-instances --filters "Name=tag:Name,Values=myeks-ng1-Node" "Name=availability-zone,Values=ap-northeast-2a" --query 'Reservations[*].Instances[*].PublicIpAddress' --output text)
export N2=$(aws ec2 describe-instances --filters "Name=tag:Name,Values=myeks-ng1-Node" "Name=availability-zone,Values=ap-northeast-2b" --query 'Reservations[*].Instances[*].PublicIpAddress' --output text)
export N3=$(aws ec2 describe-instances --filters "Name=tag:Name,Values=myeks-ng1-Node" "Name=availability-zone,Values=ap-northeast-2c" --query 'Reservations[*].Instances[*].PublicIpAddress' --output text)
echo $N1, $N2, $N3

# *remoteAccess* 포함된 보안그룹 ID
aws ec2 describe-security-groups --filters "Name=group-name,Values=*remoteAccess*" | jq
export MNSGID=$(aws ec2 describe-security-groups --filters "Name=group-name,Values=*remoteAccess*" --query 'SecurityGroups[*].GroupId' --output text)

# 해당 보안그룹 inbound 에 자신의 집 공인 IP 룰 추가
aws ec2 authorize-security-group-ingress --group-id $MNSGID --protocol '-1' --cidr $(curl -s ipinfo.io/ip)/32

# 해당 보안그룹 inbound 에 운영서버 내부 IP 룰 추가
aws ec2 authorize-security-group-ingress --group-id $MNSGID --protocol '-1' --cidr 172.20.1.100/32

# 워커 노드 SSH 접속
for i in $N1 $N2 $N3; do echo ">> node $i <<"; ssh -o StrictHostKeyChecking=no ec2-user@$i hostname; echo; done

ssh ec2-user@$N1
exit
ssh ec2-user@$N2
exit
ssh ec2-user@$N2
exit
> 노드 기본 정보 확인
# 노드 기본 정보 확인
for i in $N1 $N2 $N3; do echo ">> node $i <<"; ssh ec2-user@$i hostnamectl; echo; done
for i in $N1 $N2 $N3; do echo ">> node $i <<"; ssh ec2-user@$i sudo ip -c addr; echo; done

#
for i in $N1 $N2 $N3; do echo ">> node $i <<"; ssh ec2-user@$i lsblk; echo; done
for i in $N1 $N2 $N3; do echo ">> node $i <<"; ssh ec2-user@$i df -hT /; echo; done

# 스토리지클래스 및 CSI 노드 확인
kubectl get sc
kubectl get csinodes

# max-pods 정보 확인
kubectl describe node | grep Capacity: -A13
kubectl get nodes -o custom-columns="NAME:.metadata.name,MAXPODS:.status.capacity.pods"

# 노드에서 확인
for i in $N1 $N2 $N3; do echo ">> node $i <<"; ssh ec2-user@$i cat /etc/eks/bootstrap.sh; echo; done
ssh ec2-user@$N1 sudo cat /etc/kubernetes/kubelet/config.json | jq
for i in $N1 $N2 $N3; do echo ">> node $i <<"; ssh ec2-user@$i sudo cat /etc/kubernetes/kubelet/config.json | grep maxPods; echo; done
for i in $N1 $N2 $N3; do echo ">> node $i <<"; ssh ec2-user@$i sudo cat /etc/kubernetes/kubelet/config.json.d/00-nodeadm.conf | grep maxPods; echo; done
> 운영 서버 EC2에 접속 : AWS EKS 설치 확인
- SSH 접속 후 기본 확인
# default 네임스페이스 적용
kubectl ns default

# 환경변수 정보 확인
export | egrep 'ACCOUNT|AWS_|CLUSTER|KUBERNETES|VPC|Subnet'
export | egrep 'ACCOUNT|AWS_|CLUSTER|KUBERNETES|VPC|Subnet' | egrep -v 'KEY'

# krew 플러그인 확인
kubectl krew list
- 노드 정보 확인 및 SSH 접속
# 인스턴스 정보 확인
aws ec2 describe-instances --query "Reservations[*].Instances[*].{InstanceID:InstanceId, PublicIPAdd:PublicIpAddress, PrivateIPAdd:PrivateIpAddress, InstanceName:Tags[?Key=='Name']|[0].Value, Status:State.Name}" --filters Name=instance-state-name,Values=running --output table

# 노드 IP 확인 및 PrivateIP 변수 지정
aws ec2 describe-instances --query "Reservations[*].Instances[*].{PublicIPAdd:PublicIpAddress,PrivateIPAdd:PrivateIpAddress,InstanceName:Tags[?Key=='Name']|[0].Value,Status:State.Name}" --filters Name=instance-state-name,Values=running --output table
N1=$(kubectl get node --label-columns=topology.kubernetes.io/zone --selector=topology.kubernetes.io/zone=ap-northeast-2a -o jsonpath={.items[0].status.addresses[0].address})
N2=$(kubectl get node --label-columns=topology.kubernetes.io/zone --selector=topology.kubernetes.io/zone=ap-northeast-2b -o jsonpath={.items[0].status.addresses[0].address})
N3=$(kubectl get node --label-columns=topology.kubernetes.io/zone --selector=topology.kubernetes.io/zone=ap-northeast-2c -o jsonpath={.items[0].status.addresses[0].address})
echo "export N1=$N1" >> /etc/profile
echo "export N2=$N2" >> /etc/profile
echo "export N3=$N3" >> /etc/profile
echo $N1, $N2, $N3

# 노드 IP 로 ping 테스트
for i in $N1 $N2 $N3; do echo ">> node $i <<"; ping -c 1 $i ; echo; done
> kube-ops-view(Ingress), AWS LoadBalancer Controller, ExternalDNS, gp3 storageclass 설치
- 설치
# kube-ops-view
helm repo add geek-cookbook https://geek-cookbook.github.io/charts/
helm install kube-ops-view geek-cookbook/kube-ops-view --version 1.2.2 --set service.main.type=ClusterIP  --set env.TZ="Asia/Seoul" --namespace kube-system

# gp3 스토리지 클래스 생성
cat <<EOF | kubectl apply -f -
kind: StorageClass
apiVersion: storage.k8s.io/v1
metadata:
  name: gp3
  annotations:
    storageclass.kubernetes.io/is-default-class: "true"
allowVolumeExpansion: true
provisioner: ebs.csi.aws.com
volumeBindingMode: WaitForFirstConsumer
parameters:
  type: gp3
  allowAutoIOPSPerGBIncrease: 'true'
  encrypted: 'true'
  fsType: xfs # 기본값이 ext4
EOF
kubectl get sc

# ExternalDNS
curl -s https://raw.githubusercontent.com/gasida/PKOS/main/aews/externaldns.yaml | MyDomain=$MyDomain MyDnzHostedZoneId=$MyDnzHostedZoneId envsubst | kubectl apply -f -

# AWS LoadBalancerController
helm repo add eks https://aws.github.io/eks-charts
helm install aws-load-balancer-controller eks/aws-load-balancer-controller -n kube-system --set clusterName=$CLUSTER_NAME \
  --set serviceAccount.create=false --set serviceAccount.name=aws-load-balancer-controller

# kubeopsview 용 Ingress 설정 : group 설정으로 1대의 ALB를 여러개의 ingress 에서 공용 사용
cat <<EOF | kubectl apply -f -
apiVersion: networking.k8s.io/v1
kind: Ingress
metadata:
  annotations:
    alb.ingress.kubernetes.io/certificate-arn: $CERT_ARN
    alb.ingress.kubernetes.io/group.name: study
    alb.ingress.kubernetes.io/listen-ports: '[{"HTTPS":443}, {"HTTP":80}]'
    alb.ingress.kubernetes.io/load-balancer-name: $CLUSTER_NAME-ingress-alb
    alb.ingress.kubernetes.io/scheme: internet-facing
    alb.ingress.kubernetes.io/ssl-redirect: "443"
    alb.ingress.kubernetes.io/success-codes: 200-399
    alb.ingress.kubernetes.io/target-type: ip
  labels:
    app.kubernetes.io/name: kubeopsview
  name: kubeopsview
  namespace: kube-system
spec:
  ingressClassName: alb
  rules:
  - host: kubeopsview.$MyDomain
    http:
      paths:
      - backend:
          service:
            name: kube-ops-view
            port:
              number: 8080
        path: /
        pathType: Prefix
EOF
- 확인
# 설치된 파드 정보 확인
kubectl get pods -n kube-system

# service, ep, ingress 확인
kubectl get ingress,svc,ep -n kube-system

# Kube Ops View 접속 정보 확인
echo -e "Kube Ops View URL = https://kubeopsview.$MyDomain/#scale=1.5"
open "https://kubeopsview.$MyDomain/#scale=1.5" # macOS

> kube-ops-view(Ingress), AWS LoadBalancer Controller, ExternalDNS, gp3 storageclass 설치

> 배포
# 모니터링
watch -d 'kubectl get pod -o wide;echo;kubectl get svc'

# Bookinfo 애플리케이션 배포
kubectl apply -f https://raw.githubusercontent.com/istio/istio/refs/heads/master/samples/bookinfo/platform/kube/bookinfo.yaml

# 확인
kubectl get all,sa

# product 웹 접속 확인
kubectl exec "$(kubectl get pod -l app=ratings -o jsonpath='{.items[0].metadata.name}')" -c ratings -- curl -sS productpage:9080/productpage | grep -o "<title>.*</title>"

# 로그
kubectl stern -l app=productpage
혹은
kubectl log -l app=productpage -f


> 프로메테우스 스택 설치
. 미리 배포하여 충분히 메트릭이 쌓인 후 확인할 수 있도록 함
# 모니터링
watch kubectl get pod,pvc,svc,ingress -n monitoring

# repo 추가
helm repo add prometheus-community https://prometheus-community.github.io/helm-charts

# 파라미터 파일 생성
cat <<EOT > monitor-values.yaml
prometheus:
  prometheusSpec:
    scrapeInterval: "15s"
    evaluationInterval: "15s"
    podMonitorSelectorNilUsesHelmValues: false
    serviceMonitorSelectorNilUsesHelmValues: false
    retention: 5d
    retentionSize: "10GiB"
    storageSpec:
      volumeClaimTemplate:
        spec:
          storageClassName: gp3
          accessModes: ["ReadWriteOnce"]
          resources:
            requests:
              storage: 30Gi

  ingress:
    enabled: true
    ingressClassName: alb
    hosts:
      - prometheus.$MyDomain
    paths:
      - /*
    annotations:
      alb.ingress.kubernetes.io/scheme: internet-facing
      alb.ingress.kubernetes.io/target-type: ip
      alb.ingress.kubernetes.io/listen-ports: '[{"HTTPS":443}, {"HTTP":80}]'
      alb.ingress.kubernetes.io/certificate-arn: $CERT_ARN
      alb.ingress.kubernetes.io/success-codes: 200-399
      alb.ingress.kubernetes.io/load-balancer-name: myeks-ingress-alb
      alb.ingress.kubernetes.io/group.name: study
      alb.ingress.kubernetes.io/ssl-redirect: '443'

grafana:
  defaultDashboardsTimezone: Asia/Seoul
  adminPassword: prom-operator

  ingress:
    enabled: true
    ingressClassName: alb
    hosts:
      - grafana.$MyDomain
    paths:
      - /*
    annotations:
      alb.ingress.kubernetes.io/scheme: internet-facing
      alb.ingress.kubernetes.io/target-type: ip
      alb.ingress.kubernetes.io/listen-ports: '[{"HTTPS":443}, {"HTTP":80}]'
      alb.ingress.kubernetes.io/certificate-arn: $CERT_ARN
      alb.ingress.kubernetes.io/success-codes: 200-399
      alb.ingress.kubernetes.io/load-balancer-name: myeks-ingress-alb
      alb.ingress.kubernetes.io/group.name: study
      alb.ingress.kubernetes.io/ssl-redirect: '443'

  persistence:
    enabled: true
    type: sts
    storageClassName: "gp3"
    accessModes:
      - ReadWriteOnce
    size: 20Gi

alertmanager:
  enabled: false
defaultRules:
  create: false
kubeControllerManager:
  enabled: false
kubeEtcd:
  enabled: false
kubeScheduler:
  enabled: false
prometheus-windows-exporter:
  prometheus:
    monitor:
      enabled: false
EOT
cat monitor-values.yaml

# 배포
helm install kube-prometheus-stack prometheus-community/kube-prometheus-stack --version 69.3.1 \
-f monitor-values.yaml --create-namespace --namespace monitoring

# 확인
## alertmanager-0 : 사전에 정의한 정책 기반(예: 노드 다운, 파드 Pending 등)으로 시스템 경고 메시지를 생성 후 경보 채널(슬랙 등)로 전송
## grafana-0 : 프로메테우스는 메트릭 정보를 저장하는 용도로 사용하며, 그라파나로 시각화 처리
## prometheus-0 : 모니터링 대상이 되는 파드는 ‘exporter’라는 별도의 사이드카 형식의 파드에서 모니터링 메트릭을 노출, pull 방식으로 가져와 내부의 시계열 데이터베이스에 저장
## node-exporter : 노드익스포터는 물리 노드에 대한 자원 사용량(네트워크, 스토리지 등 전체) 정보를 메트릭 형태로 변경하여 노출
## operator : 시스템 경고 메시지 정책(prometheus rule), 애플리케이션 모니터링 대상 추가 등의 작업을 편리하게 할수 있게 CRD 지원
## kube-state-metrics : 쿠버네티스의 클러스터의 상태(kube-state)를 메트릭으로 변환하는 파드
helm list -n monitoring
kubectl get sts,ds,deploy,pod,svc,ep,ingress,pvc,pv -n monitoring
kubectl get-all -n monitoring
kubectl get prometheus,servicemonitors -n monitoring
kubectl get crd | grep monitoring
kubectl df-pv

# 프로메테우스 버전 확인
echo -e "https://prometheus.$MyDomain/api/v1/status/buildinfo"
open https://prometheus.$MyDomain/api/v1/status/buildinfo # macOS
kubectl exec -it sts/prometheus-kube-prometheus-stack-prometheus -n monitoring -c prometheus -- prometheus --version
prometheus, version 3.1.0 (branch: HEAD, revision: 7086161a93b262aa0949dbf2aba15a5a7b13e0a3)
...

# 프로메테우스 웹 접속
echo -e "https://prometheus.$MyDomain"
open "https://prometheus.$MyDomain" # macOS

# 그라파나 웹 접속
echo -e "https://grafana.$MyDomain"
open "https://grafana.$MyDomain" # macOS


> Grafana 계정 정보는 Secret에 있다. (id : admin / pswd : prom-operator)
1. 배경 설명
* 모니터링(Monitoring)과 관측 가능성 (observability - o11y)의 정의와 차이점
|
항목
|
모니터링(Monitoring)
|
관측가능성(Observability
|
|
정의
|
특정 메트릭 추적으로 문제 감지
|
외부 출력 데이터로 시스템 상태 이해
|
|
목표
|
문제 발생 시 감지 및 경고
|
문제 원인 진단 및 시스템 최적화
|
|
데이터 소스
|
미리 정의된 메트릭 (CPU, 메모리 등)
|
로그, 메트릭, 트레이스, 이벤트 등
|
|
시스템 유형
|
단순한 시스템, 잘 알려진 파라미터
|
복잡한 분산 시스템, 다중 컴포넌트
|
|
상호작용 방식
|
정적 경고 (임계값 기반)
|
동적 쿼리 및 분석 (질문 기반)
|
모니터링 (Monitoring) - 감시 중심
- 정의: 사전에 정의된 기준(지표)을 바탕으로 시스템 상태를 감시
- 목적: 시스템이 정상적으로 작동하는지 확인 및 이상 발생 시 경고
- 데이터: CPU, 메모리, 오류율 등의 사전 정의된 메트릭을 지속적으로 수집
- 특징:
- 예측 가능한 문제 감지 (예: CPU 90% 초과 시 경고).
- 단순한 시스템에 적합 (예: 단일 서버).
- 주로 임계값 기반 경고 시스템 사용
- 예시: "서버가 다운되었는가?", "서버의 메모리 임계치를 초과했는가?"
관측 가능성 (Observability) - 분석 중심
- 정의: 로그, 메트릭, 트레이스 등을 통해 시스템의 내부 상태를 파악하는 능력
- 목적: 복잡한 분산 시스템에서 예측되지 않은 문제를 분석하고 원인 파악
- 데이터: 로그(이벤트 기록), 메트릭(성능 수치), 트레이스(요청 흐름 추적) 활용
- 특징:
- 새로운 문제 탐색 가능 (예: 특정 요청이 실패한 이유 분석).
- 복잡한 분산 시스템에 필수 (예: 마이크로서비스).
- 사전 정의된 경고 없이도 동적 쿼리 및 분석 가능.
- 예시: "서버가 왜 다운되었는가?", "왜 응답 시간이 느려졌는가?"
차이점 요약
| 목적 | 시스템 상태 감시 | 문제 원인 분석 |
| 데이터 | 사전 정의된 메트릭 (CPU, 메모리 등) | 로그 + 메트릭 + 트레이스 |
| 대상 | 단순한 시스템 (예: 단일 서버) | 복잡한 시스템 (예: 마이크로서비스) |
| 방식 | 임계값 초과 시 알림 | 동적 분석 가능 |
| 예시 질문 | "서버 다운 감지" | "왜 서버가 다운됐는가?" |
* 메트릭(Metric), 로그(Log), 추적(Trace)
|
항목
|
메트릭 (metric)
|
로그 (log)
|
추적 (trace)
|
|
정의
|
수치로 표현된 성능 데이터
|
시스템 이벤트 기록
|
요청이 시스템을 거치는 과정 추적
|
|
형태
|
숫자 (정량적 데이터)
|
텍스트 (비정형 데이터)
|
트랜잭션 흐름 데이터
|
|
예시 데이터
|
CPU 사용률, 응답 시간, 요청 수
|
오류 메시지, 로그인 시도, API 호출 로그
|
A 서비스 → B 서비스 → C 서비스 요청 흐름
|
|
주요 목적
|
시스템 성능 모니터링 및 알람
|
이벤트 분석 및 디버깅
|
서비스 간 호출 경로 및 병목 현상 분석
|
|
저장 방식
|
시계열 데이터베이스(TSDB)
|
로그 파일 또는 로그 관리 시스템
|
분산 트레이싱 시스템 (Jaeger, Zipkin)
|
|
활용 도구
|
Prometheus, Grafana
|
ELK Stack, Loki
|
Jaeger, Zipkin
|
- 메트릭 : 시스템의 성능의 정량적 지표
- 로그 : 이벤트 기반 디버깅, 문제 분석에 사용
- 추적 : 분산 시스템에서 요청의 흐름 파악 및 병목 구간 분석
* SLI, SLO, SLA
|
항목
|
SLI (서비스 수준 지표)
|
SLO (서비스 수준 목표)
|
SLA (서비스 수준 계약)
|
|
정의
|
서비스 성능을 측정하는 실제 값
|
유지해야 하는 성능 목표
|
고객과 맺은 공식 계약
|
|
목적
|
현재 서비스 상태를 모니터링
|
내부적으로 목표 수준을 설정
|
고객과의 계약 보장
|
|
예제
|
99.95%의 가용성
|
99.9% 이상의 가용성 목표
|
99.9% 미만이면 환불 제공
|
|
법적 구속력
|
없음
|
없음
|
있음
|
|
위반 시 결과
|
단순 데이터 측정
|
내부 경고 및 개선 조치
|
보상금 지급, 계약 위반 가능
|
- SLI : 서비스 성능 정량 측정 지표 (ex. 응답시간, 가용성, 오류율, 지연율)
- SLO : 서비스가 유지해야하는 목표 수준 (ex. 가용성 x % 이상 유지, 요청의 99%는 200ms 이내 응답, 오류율 0.1% 이하 유지)
- SLA : 서비스 제공자와 고객 간 체결된 법적 계약 문서 (ex. 가용성이 x % 미만이면 10% 환불 등)
2. EKS Console
- Kubernetes API를 통한 리소스 및 정보 확인
#
kubectl get ClusterRole | grep eks
eks:addon-manager                                                      2023-05-08T04:22:45Z
eks:az-poller                                                          2023-05-08T04:22:42Z
eks:certificate-controller-approver                                    2023-05-08T04:22:42Z
...

> 콘솔 각 메뉴에서 확인 가능한 리소스 (EKS - 내 클러스터 - 리소스)

-
- 워크로드: Pods, ReplicaSets, Deployments, and DaemonSets
- Pods : 네임스페이스 필터, 구조화된 보기 structured view vs 원시 보기 raw view
- 클러스터: Nodes, Namespaces and API Services
- Nodes : 노드 상태 및 정보, Taints, Conditions, Labels, Annotations 등
- 서비스 및 네트워킹 : Pods as Service, Endpoints and Ingresses
- Service : 서비스 정보, 로드 밸런서(CLB/NLB) URL 정보 등
- 구성 및 보안 암호 : ConfigMap and Secrets
- ConfigMap & Secrets : 정보 확인, 디코드 Decode 지원
- 스토리지 : PVC, PV, Storage Classes, Volume Attachments, CSI Drivers, CSI Nodes
- PVC : 볼륨 정보, 주석, 이벤트
- Volume Attachments : PVC가 연결된 CSI Node 정보
- 인증 : Service Account
- Service Account : IAM 역할 arn , add-on 연동
- 권한 부여 : Cluster Roles, Roles, ClusterRoleBindings and RoleBindings
- Cluster Roles & Roles : Roles 에 규칙 확인
- 정책 : Limit Ranges, Resource Quotas, Network Policies, Pod Disruption Budgets, Pod Security Policies
- Pod Security Policies : (기본값) eks.privileged 정보 확인
- 확장 프로그램 : Custom Resource Definitions, Mutating Webhook Configurations, and Validating Webhook Configurations
- CRD 및 Webhook 확인
- 워크로드: Pods, ReplicaSets, Deployments, and DaemonSets
3. Logging in EKS
- EKS의 로깅을 활성화하면, 컨트롤 플레인, 노드, 어플리케이션 로그를 확인할 수 있다.
* Control Plane Logging : 로그 이름 (/aws/eks/$(cluster-name)/cluster)
-> EKSCTL 배포 기본값으로 컨트롤 플레인 로깅이 비활성화 되어 있음

# 모든 로깅 활성화
aws eks update-cluster-config --region ap-northeast-2 --name $CLUSTER_NAME \
    --logging '{"clusterLogging":[{"types":["api","audit","authenticator","controllerManager","scheduler"],"enabled":true}]}'

# 로그 그룹 확인
aws logs describe-log-groups | jq

# 로그 tail 확인 : aws logs tail help
aws logs tail /aws/eks/$CLUSTER_NAME/cluster | more

# 신규 로그를 바로 출력
aws logs tail /aws/eks/$CLUSTER_NAME/cluster --follow

# 필터 패턴
aws logs tail /aws/eks/$CLUSTER_NAME/cluster --filter-pattern <필터 패턴>

# 로그 스트림이름
aws logs tail /aws/eks/$CLUSTER_NAME/cluster --log-stream-name-prefix <로그 스트림 prefix> --follow
aws logs tail /aws/eks/$CLUSTER_NAME/cluster --log-stream-name-prefix kube-apiserver --follow
aws logs tail /aws/eks/$CLUSTER_NAME/cluster --log-stream-name-prefix kube-apiserver-audit --follow
aws logs tail /aws/eks/$CLUSTER_NAME/cluster --log-stream-name-prefix kube-scheduler --follow
aws logs tail /aws/eks/$CLUSTER_NAME/cluster --log-stream-name-prefix authenticator --follow
aws logs tail /aws/eks/$CLUSTER_NAME/cluster --log-stream-name-prefix kube-controller-manager --follow
aws logs tail /aws/eks/$CLUSTER_NAME/cluster --log-stream-name-prefix cloud-controller-manager --follow
kubectl scale deployment -n kube-system coredns --replicas=1
kubectl scale deployment -n kube-system coredns --replicas=2

# 시간 지정: 1초(s) 1분(m) 1시간(h) 하루(d) 한주(w)
aws logs tail /aws/eks/$CLUSTER_NAME/cluster --since 1h30m

# 짧게 출력
aws logs tail /aws/eks/$CLUSTER_NAME/cluster --since 1h30m --format short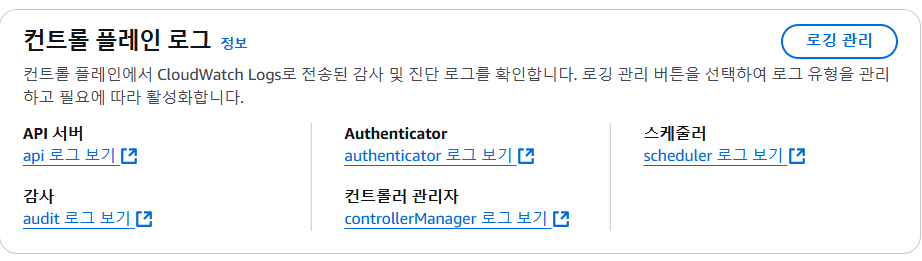

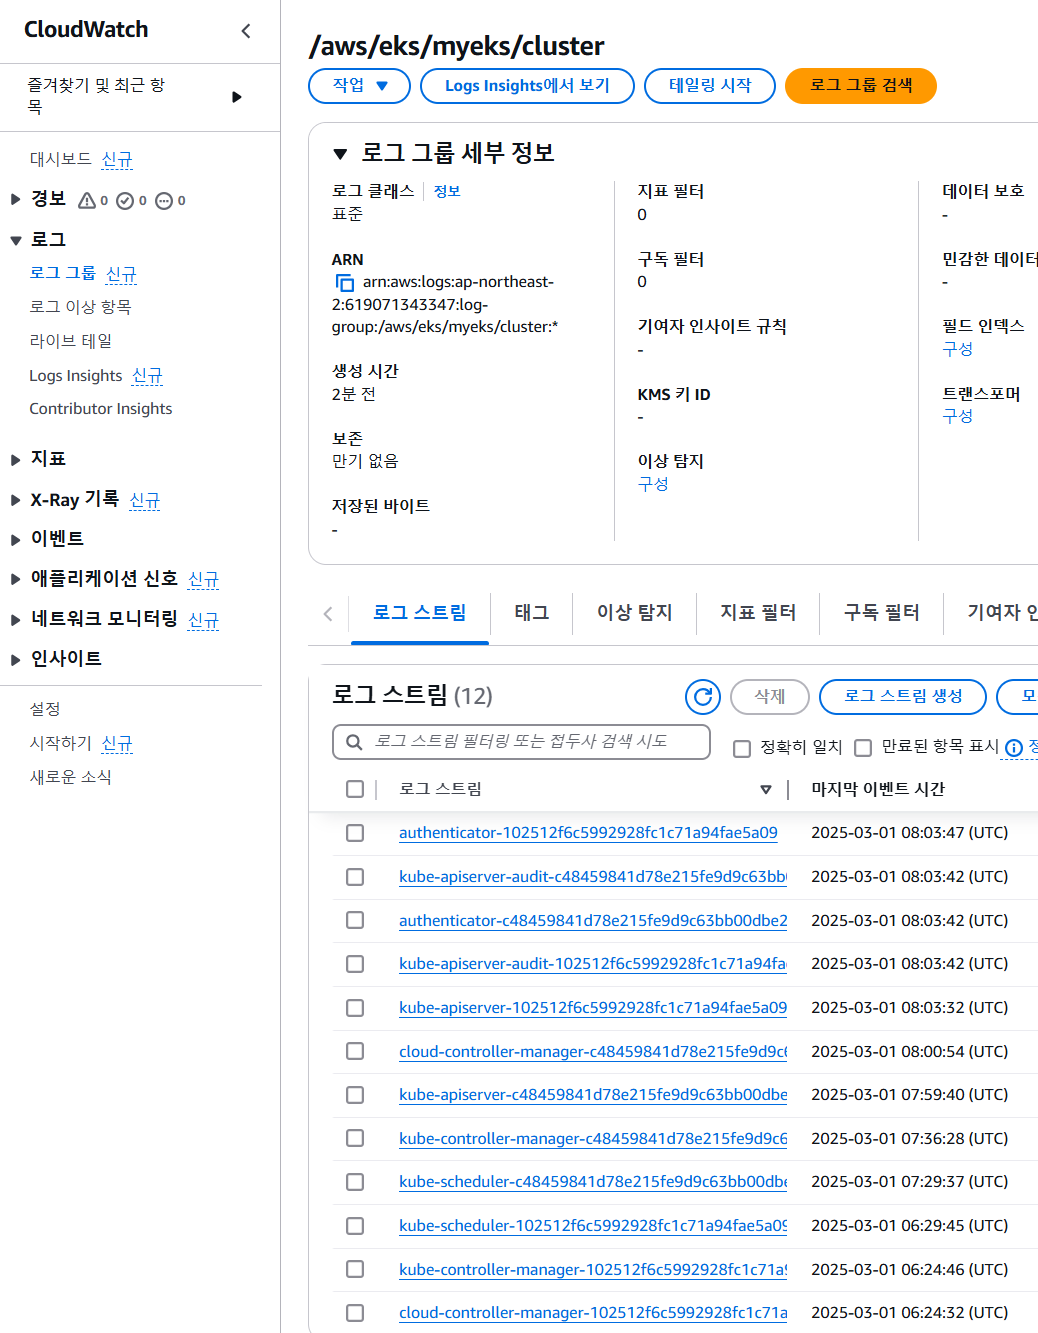

* CloudWatch Log Insights : 로그 그룹 선택 후 쿼리를 통해 필터링하여 원하는 로그를 확인 할 수 있음
# EC2 Instance가 NodeNotReady 상태인 로그 검색
fields @timestamp, @message
| filter @message like /NodeNotReady/
| sort @timestamp desc
# kube-apiserver-audit 로그에서 userAgent 정렬해서 아래 4개 필드 정보 검색
fields userAgent, requestURI, @timestamp, @message
| filter @logStream ~= "kube-apiserver-audit"
| stats count(userAgent) as count by userAgent
| sort count desc
#
fields @timestamp, @message
| filter @logStream ~= "kube-scheduler"
| sort @timestamp desc
#
fields @timestamp, @message
| filter @logStream ~= "authenticator"
| sort @timestamp desc
#
fields @timestamp, @message
| filter @logStream ~= "kube-controller-manager"
| sort @timestamp desc

* 로깅 끄기
# EKS Control Plane 로깅(CloudWatch Logs) 비활성화
eksctl utils update-cluster-logging --cluster $CLUSTER_NAME --region ap-northeast-2 --disable-types all --approve

# 로그 그룹 삭제
aws logs delete-log-group --log-group-name /aws/eks/$CLUSTER_NAME/cluster

* 컨테이너 (Pod) 로깅
> Nginx 웹서버 배포 (with Ingress - ALB)
# NGINX 웹서버 배포
helm repo add bitnami https://charts.bitnami.com/bitnami
helm repo update

# 도메인, 인증서 확인
echo $MyDomain $CERT_ARN

# 파라미터 파일 생성
cat <<EOT > nginx-values.yaml
service:
  type: NodePort

networkPolicy:
  enabled: false

resourcesPreset: "nano"

ingress:
  enabled: true
  ingressClassName: alb
  hostname: nginx.$MyDomain
  pathType: Prefix
  path: /
  annotations:
    alb.ingress.kubernetes.io/certificate-arn: $CERT_ARN
    alb.ingress.kubernetes.io/group.name: study
    alb.ingress.kubernetes.io/listen-ports: '[{"HTTPS":443}, {"HTTP":80}]'
    alb.ingress.kubernetes.io/load-balancer-name: $CLUSTER_NAME-ingress-alb
    alb.ingress.kubernetes.io/scheme: internet-facing
    alb.ingress.kubernetes.io/ssl-redirect: "443"
    alb.ingress.kubernetes.io/success-codes: 200-399
    alb.ingress.kubernetes.io/target-type: ip
EOT
cat nginx-values.yaml

# 배포
helm install nginx bitnami/nginx --version 19.0.0 -f nginx-values.yaml

# 확인
kubectl get ingress,deploy,svc,ep nginx
kubectl describe deploy nginx # Resource - Limits/Requests 확인
kubectl get targetgroupbindings # ALB TG 확인

# 접속 주소 확인 및 접속
echo -e "Nginx WebServer URL = https://nginx.$MyDomain"
curl -s https://nginx.$MyDomain
kubectl stern deploy/nginx
혹은
kubectl logs deploy/nginx -f

# 반복 접속
while true; do curl -s https://nginx.$MyDomain | grep title; date; sleep 1; done
while true; do curl -s https://nginx.$MyDomain -I | head -n 1; date; sleep 1; done
> 외부이서 접속이 잘되나, 운영 EC2에서 curl 접속이 안되는 경우
더보기
dig +short nginx.$MyDomain
dig +short nginx.$MyDomain @172.20.0.2
dig +short nginx.$MyDomain @1.1.1.1
dig +short nginx.$MyDomain @8.8.8.8
cat /etc/resolv.conf
sed -i "s/^nameserver 172.20.0.2/nameserver 1.1.1.1/g" /etc/resolv.conf
cat /etc/resolv.conf
dig +short nginx.$MyDomain
dig +short nginx.$MyDomain @8.8.8.8
dig +short nginx.$MyDomain @172.20.0.2
curl -s https://nginx.$MyDomain
* 컨테이너 로그 환경의 로그는 표준 출력 stdout과 표준 에러 stderr로 보내는 것을 권고
- 컨테이너 이미지 생성시 주로 조회하는 로그는 stdout, stderr로 출력하도록 설정하여 컨테이너 접속 및 로그 위치에 상관 없이 kubectl logs 명령어로 조회 가능 => 종료된 Pod의 로그는 조회할 수 없음
# 로그 모니터링
kubectl stern deploy/nginx
혹은
kubectl logs deploy/nginx -f

# nginx 웹 접속 시도

# 컨테이너 로그 파일 위치 확인
kubectl exec -it deploy/nginx -- ls -l /opt/bitnami/nginx/logs/
total 0
lrwxrwxrwx 1 root root 11 Feb 18 13:35 access.log -> /dev/stdout
lrwxrwxrwx 1 root root 11 Feb 18 13:35 error.log -> /dev/stderr
> Dockerfile 예시
RUN ln -sf /dev/stdout /opt/bitnami/nginx/logs/access.log
RUN ln -sf /dev/stderr /opt/bitnami/nginx/logs/error.log

or

# forward request and error logs to docker log collector
RUN ln -sf /dev/stdout /var/log/nginx/access.log \
 && ln -sf /dev/stderr /var/log/nginx/error.log
> kubelet 기본 설정 : log 파일 크기 최대 10Mi, 5개 파일로 초과 분은 조회 불가
# AL2 경우
cat /etc/kubernetes/kubelet-config.yaml
...
containerLogMaxSize: 10Mi
> AL2에서 로그 파일 크기 및 수량 수정
apiVersion: eksctl.io/v1alpha5
kind: ClusterConfig

metadata:
  name: <cluster-name>
  region: eu-central-1

nodeGroups:
  - name: worker-spot-containerd-large-log
    labels: { instance-type: spot }
    instanceType: t3.large
    minSize: 2
    maxSize: 30
    desiredCapacity: 2
    amiFamily: AmazonLinux2
    containerRuntime: containerd
    availabilityZones: ["eu-central-1a", "eu-central-1b", "eu-central-1c"]
    kubeletExtraConfig:
      containerLogMaxSize: "50Mi"
      containerLogMaxFiles: 10
=> CloudWatch Container Insights + Fluent Bit로 파드 로그를 수집하고 저장할 수 있음
4. Container Insights metrics in Amazon CloudWatch & Fluent Bit (Logs)
* CloudWatch Container Observability
. 노드에 CloudWatch Agent 파드와 Fluent Bit 파드가 데몬셋으로 기동되어 메트릭고 로그 수집
* Fluent Bit 과 CloudWatch Container Insight 통합

- 수집 : Fluent Bit이 아래 3가지 종류의 로그를 CloudWatch 로그에 전송
. /aws/containerinsights/Cluster_Name/application : 로그 소스(All log files in /var/log/containers), 각 컨테이너/파드 로그
. /aws/containerinsights/Cluster_Name/host : 로그 소스(Logs from /var/log/dmesg, /var/log/secure, /var/log/messages), 노드(호스트) 로그
. /aws/containerinsights/Cluster_Name/dataplane : 로그 소스(/var/log/journal for kubelet.service, kubeproxy.service, and docker.service), 쿠버네티스 데이터플레인 로그
- 저장 : CloudWatch Logs에 저장, 로그 그룹 별 로그 보존 기간 설정 가능
- 시각화 : CloudWatch의 Log Insights를 사용하여 로그 분석 및 대시보드 구성
> CloudWatch Container Observability 설치
# IRSA 설정
eksctl create iamserviceaccount \
  --name cloudwatch-agent \
  --namespace amazon-cloudwatch --cluster $CLUSTER_NAME \
  --role-name $CLUSTER_NAME-cloudwatch-agent-role \
  --attach-policy-arn arn:aws:iam::aws:policy/CloudWatchAgentServerPolicy \
  --role-only \
  --approve

# addon 배포
aws eks create-addon --addon-name amazon-cloudwatch-observability --cluster-name $CLUSTER_NAME --service-account-role-arn arn:aws:iam::$ACCOUNT_ID:role/$CLUSTER_NAME-cloudwatch-agent-role
aws eks create-addon --addon-name amazon-cloudwatch-observability --cluster-name myeks --service-account-role-arn arn:aws:iam::<IAM User Account ID직접 입력>:role/myeks-cloudwatch-agent-role

# addon 확인
aws eks list-addons --cluster-name myeks --output table


# 설치 확인
kubectl get crd | grep -i cloudwatch
kubectl get-all -n amazon-cloudwatch
kubectl get ds,pod,cm,sa,amazoncloudwatchagent -n amazon-cloudwatch
kubectl describe clusterrole cloudwatch-agent-role amazon-cloudwatch-observability-manager-role    # 클러스터롤 확인
kubectl describe clusterrolebindings cloudwatch-agent-role-binding amazon-cloudwatch-observability-manager-rolebinding  # 클러스터롤 바인딩 확인
kubectl -n amazon-cloudwatch logs -l app.kubernetes.io/component=amazon-cloudwatch-agent -f # 파드 로그 확인
kubectl -n amazon-cloudwatch logs -l k8s-app=fluent-bit -f    # 파드 로그 확인

# cloudwatch-agent 설정 확인
kubectl describe cm cloudwatch-agent -n amazon-cloudwatch
kubectl get cm cloudwatch-agent -n amazon-cloudwatch -o jsonpath="{.data.cwagentconfig\.json}" | jq
{
  "agent": {
    "region": "ap-northeast-2"
  },
  "logs": {
    "metrics_collected": {
      "application_signals": {
        "hosted_in": "myeks"
      },
      "kubernetes": {
        "cluster_name": "myeks",
        "enhanced_container_insights": true
      }
    }
  },
  "traces": {
    "traces_collected": {
      "application_signals": {}
    }
  }
}

#Fluent bit 파드 수집하는 방법 : Volumes에 HostPath를 살펴보자! >> / 호스트 패스 공유??? 보안상 안전한가? 좀 더 범위를 좁힐수는 없을까요?
kubectl describe -n amazon-cloudwatch ds cloudwatch-agent
...
  Volumes:
   ...
   rootfs:
    Type:          HostPath (bare host directory volume)
    Path:          /
    HostPathType:


# Fluent Bit 로그 INPUT/FILTER/OUTPUT 설정 확인 - 링크
## 설정 부분 구성 : application-log.conf , dataplane-log.conf , fluent-bit.conf , host-log.conf , parsers.conf
kubectl describe cm fluent-bit-config -n amazon-cloudwatch
...
application-log.conf:
----
[INPUT]
    Name                tail
    Tag                 application.*
    Exclude_Path        /var/log/containers/cloudwatch-agent*, /var/log/containers/fluent-bit*, /var/log/containers/aws-node*, /var/log/containers/kube-proxy*
    Path                /var/log/containers/*.log
    multiline.parser    docker, cri
    DB                  /var/fluent-bit/state/flb_container.db
    Mem_Buf_Limit       50MB
    Skip_Long_Lines     On
    Refresh_Interval    10
    Rotate_Wait         30
    storage.type        filesystem
    Read_from_Head      ${READ_FROM_HEAD}
...

[FILTER]
    Name                kubernetes
    Match               application.*
    Kube_URL            https://kubernetes.default.svc:443
    Kube_Tag_Prefix     application.var.log.containers.
    Merge_Log           On
    Merge_Log_Key       log_processed
    K8S-Logging.Parser  On
    K8S-Logging.Exclude Off
    Labels              Off
    Annotations         Off
    Use_Kubelet         On
    Kubelet_Port        10250
    Buffer_Size         0

[OUTPUT]
    Name                cloudwatch_logs
    Match               application.*
    region              ${AWS_REGION}
    log_group_name      /aws/containerinsights/${CLUSTER_NAME}/application
    log_stream_prefix   ${HOST_NAME}-
    auto_create_group   true
    extra_user_agent    container-insights
...

# Fluent Bit 파드가 수집하는 방법 : Volumes에 HostPath를 살펴보자!
kubectl describe -n amazon-cloudwatch ds fluent-bit
...
ssh ec2-user@$N1 sudo tree /var/log
ssh ec2-user@$N2 sudo tree /var/log
ssh ec2-user@$N3 sudo tree /var/log
> HostPath의 root directory "/"에 마운트하여 로그 조회 가능하며, host에서 사용하는 docker.sock이 Pod에 마운트되었는 상태에서 공격자가 해당 Pod에 docker만 설치할 수 ㅣㅇㅆ다면, docker.sock을 이용해서 host(노드)의 docker에 명령을 보낼 수 있게됨
> 노드의 로그 확인
- application 로그 소스(All log files in /var/log/containers → 심볼릭 링크 /var/log/pods/<컨테이너>, 각 컨테이너/파드 로그
# 로그 위치 확인
#ssh ec2-user@$N1 sudo tree /var/log/containers
#ssh ec2-user@$N1 sudo ls -al /var/log/containers
for node in $N1 $N2 $N3; do echo ">>>>> $node <<<<<"; ssh ec2-user@$node sudo tree /var/log/containers; echo; done
for node in $N1 $N2 $N3; do echo ">>>>> $node <<<<<"; ssh ec2-user@$node sudo ls -al /var/log/containers; echo; done

# 개별 파드 로그 확인 : 아래 각자 디렉터리 경로는 다름
ssh ec2-user@$N1 sudo tail -f /var/log/pods/default_nginx-685c67bc9-pkvzd_69b28caf-7fe2-422b-aad8-f1f70a206d9e/nginx/0.log
- host 로그 소스(Logs from /var/log/dmesg, /var/log/secure, and /var/log/messages), 노드(호스트) 로그
# 로그 위치 확인
#ssh ec2-user@$N1 sudo tree /var/log/ -L 1
#ssh ec2-user@$N1 sudo ls -la /var/log/
for node in $N1 $N2 $N3; do echo ">>>>> $node <<<<<"; ssh ec2-user@$node sudo tree /var/log/ -L 1; echo; done
for node in $N1 $N2 $N3; do echo ">>>>> $node <<<<<"; ssh ec2-user@$node sudo ls -la /var/log/; echo; done

# 호스트 로그 확인
#ssh ec2-user@$N1 sudo tail /var/log/dmesg
#ssh ec2-user@$N1 sudo tail /var/log/secure
#ssh ec2-user@$N1 sudo tail /var/log/messages
for log in dmesg secure messages; do echo ">>>>> Node1: /var/log/$log <<<<<"; ssh ec2-user@$N1 sudo tail /var/log/$log; echo; done
for log in dmesg secure messages; do echo ">>>>> Node2: /var/log/$log <<<<<"; ssh ec2-user@$N2 sudo tail /var/log/$log; echo; done
for log in dmesg secure messages; do echo ">>>>> Node3: /var/log/$log <<<<<"; ssh ec2-user@$N3 sudo tail /var/log/$log; echo; done
- dataplane 로그 소스(/var/log/journal for kubelet.service, kubeproxy.service, and docker.service), 쿠버네티스 데이터플레인 로그
# 로그 위치 확인
#ssh ec2-user@$N1 sudo tree /var/log/journal -L 1
#ssh ec2-user@$N1 sudo ls -la /var/log/journal
for node in $N1 $N2 $N3; do echo ">>>>> $node <<<<<"; ssh ec2-user@$node sudo tree /var/log/journal -L 1; echo; done

# 저널 로그 확인 - 링크
ssh ec2-user@$N3 sudo journalctl -x -n 200
ssh ec2-user@$N3 sudo journalctl -f
> 운영 서버 EC2 로그 확인 : nginx 웹서버
# 부하 발생
curl -s https://nginx.$MyDomain
yum install -y httpd
ab -c 500 -n 30000 https://nginx.$MyDomain/

# 파드 직접 로그 모니터링
kubectl stern deploy/nginx
> 메트릭 확인 : CloudWatch -> Insights -> Container Insights
. 특정 파드 성능 지표, 노드 성능 지표 등 확인 가능


* CCO 삭제 (addon 삭제 후 로그그룹 삭제)
aws eks delete-addon --cluster-name $CLUSTER_NAME --addon-name amazon-cloudwatch-observability5. Metrics-server & kwatch & botkube
- Metrics-server : kubelet으로부터 수집한 리소스 메트릭 수집 및 집계하는 Add-On
* cAdvisor : kubelet에 포함된 컨테이너 메트릭 수집, 집계, 노출하는 데몬

> 배포 및 메트릭 확인
# 배포 : addon 으로 배포되어 있음
kubectl apply -f https://github.com/kubernetes-sigs/metrics-server/releases/latest/download/components.yaml

# 메트릭 서버 확인 : 메트릭은 15초 간격으로 cAdvisor를 통하여 가져옴
kubectl get pod -n kube-system -l app.kubernetes.io/name=metrics-server
kubectl api-resources | grep metrics
kubectl get apiservices |egrep '(AVAILABLE|metrics)'

# 노드 메트릭 확인
kubectl top node

# 파드 메트릭 확인
kubectl top pod -A
kubectl top pod -n kube-system --sort-by='cpu'
kubectl top pod -n kube-system --sort-by='memory'
- kwatch : 클러스터의 변화 감지, 실시간 어플리케이션(컨테이너) 비정상 동작 감지, 알림 발송 가능
# 닉네임
NICK=<각자 자신의 닉네임>
NICK=gasida

# configmap 생성
cat <<EOF | kubectl apply -f -
apiVersion: v1
kind: Namespace
metadata:
  name: kwatch
---
apiVersion: v1
kind: ConfigMap
metadata:
  name: kwatch
  namespace: kwatch
data:
  config.yaml: |
    alert:
      slack:
        webhook: '$(your_webhook)'
        title: $NICK-eks
    pvcMonitor:
      enabled: true
      interval: 5
      threshold: 70
EOF

# 배포
kubectl apply -f https://raw.githubusercontent.com/abahmed/kwatch/v0.8.5/deploy/deploy.yaml
kubectl apply -f https://raw.githubusercontent.com/abahmed/kwatch/v0.10.1/deploy/deploy.yaml
> 잘못된 이미지 파드 배포 및 확인 실습
# 터미널1
watch kubectl get pod

# 잘못된 이미지 정보의 파드 배포
cat <<EOF | kubectl apply -f -
apiVersion: v1
kind: Pod
metadata:
  name: nginx-19
spec:
  containers:
  - name: nginx-pod
    image: nginx:1.19.19  # 존재하지 않는 이미지 버전
EOF
kubectl get events -w

# 이미지 업데이트 방안2 : set 사용 - iamge 등 일부 리소스 값을 변경 가능!
kubectl set
kubectl set image pod nginx-19 nginx-pod=nginx:1.19

# 삭제
kubectl delete pod nginx-19


# (옵션) 노드1번 강제 재부팅 해보기
ssh $N1 sudo reboot

* kwatch 삭제 : kubectl delete -f https://raw.githubusercontent.com/abahmed/kwatch/v0.8.5/deploy/deploy.yaml
6. 프로메테우스-스택
- 프로메테우스는 오픈 소스 모니터링 시스템
. 시계열 데이터 모델(TSDB): 메트릭 이름과 key/value 쌍으로 구성된 다차원 데이터 모델
. PromQL: 시계열 데이터를 효율적으로 조회할 수 있는 쿼리 언어
. 분산 스토리지 미사용: 단일 서버 노드가 독립적으로 운영됨
. 데이터 수집 방식: HTTP 기반 Pull 모델 사용(예외적으로 Push Gateway 지원)
. 타겟 검색: 서비스 디스커버리 또는 정적 설정으로 관리
. 시각화 지원: 다양한 그래프 및 대시보드 모드 제공.
* Push vs Pull 방식 차이점
. Pull 방식: 모니터링 시스템이 주기적으로 데이터를 요청(Prometheus 기본 방식)
+ 대상 서버 부담 적음, 데이터 유실 방지
- 방화벽 설정 필요, 비정상 노드 감지 어려움
. Push 방식: 애플리케이션이 직접 데이터를 전송.
+ 실시간 데이터 수집 가능, 비정상 노드도 마지막 데이터 전송 가능
- 대상 서버 부담 증가, 데이터 유실 가능

* 구성요소
. Prometheus 서버: 메트릭 데이터를 주기적으로 수집하고 저장
. 클라이언트 라이브러리: 애플리케이션이 직접 메트릭을 노출하도록 지원
. Push Gateway: 짧은 작업(Job)의 메트릭을 Prometheus로 전달
. 익스포터: 외부 서비스(MySQL, Redis 등)의 데이터를 Prometheus 형식으로 변환
. Alertmanager: 이상 징후 감지 시 알림 전송
. Grafana 등 시각화 및 운영 도구 등
* 메트릭
- 프로메테우스는 시계열 메트릭을 수집함 : 시간에 따른 정량적 수치의 변화

> 운영서버 EC2에 프로메테우스 직접 설치
- 프로메테우스 설치
# 최신 버전 다운로드
wget https://github.com/prometheus/prometheus/releases/download/v3.2.0/prometheus-3.2.0.linux-amd64.tar.gz

# 압축 해제
tar -xvf prometheus-3.2.0.linux-amd64.tar.gz
cd prometheus-3.2.0.linux-amd64
ls -l

#
mv prometheus /usr/local/bin/
mv promtool /usr/local/bin/
mkdir -p /etc/prometheus /var/lib/prometheus
mv prometheus.yml /etc/prometheus/
cat /etc/prometheus/prometheus.yml

#
useradd --no-create-home --shell /sbin/nologin prometheus
chown -R prometheus:prometheus /etc/prometheus /var/lib/prometheus
chown prometheus:prometheus /usr/local/bin/prometheus /usr/local/bin/promtool

#
tee /etc/systemd/system/prometheus.service > /dev/null <<EOF
[Unit]
Description=Prometheus
Wants=network-online.target
After=network-online.target

[Service]
User=prometheus
Group=prometheus
Type=simple
ExecStart=/usr/local/bin/prometheus \
  --config.file=/etc/prometheus/prometheus.yml \
  --storage.tsdb.path=/var/lib/prometheus \
  --web.listen-address=0.0.0.0:9090

[Install]
WantedBy=multi-user.target
EOF

#
systemctl daemon-reload
systemctl enable --now prometheus
systemctl status prometheus
ss -tnlp

#
curl localhost:9090/metrics
echo -e "http://$(curl -s ipinfo.io/ip):9090"
- 노드 익스포터 설치
# Node Exporter 최신 버전 다운로드
cd ~
wget https://github.com/prometheus/node_exporter/releases/download/v1.9.0/node_exporter-1.9.0.linux-amd64.tar.gz
tar xvfz node_exporter-1.9.0.linux-amd64.tar.gz
cd node_exporter-1.9.0.linux-amd64
cp node_exporter /usr/local/bin/

#
groupadd -f node_exporter
useradd -g node_exporter --no-create-home --shell /sbin/nologin node_exporter
chown node_exporter:node_exporter /usr/local/bin/node_exporter

#
tee /etc/systemd/system/node_exporter.service > /dev/null <<EOF
[Unit]
Description=Node Exporter
Documentation=https://prometheus.io/docs/guides/node-exporter/
Wants=network-online.target
After=network-online.target

[Service]
User=node_exporter
Group=node_exporter
Type=simple
Restart=on-failure
ExecStart=/usr/local/bin/node_exporter \
  --web.listen-address=:9200

[Install]
WantedBy=multi-user.target
EOF

# 데몬 실행
systemctl daemon-reload
systemctl enable --now node_exporter
systemctl status node_exporter
ss -tnlp

#
curl localhost:9200/metrics
- Prometheus 설정에 수집 대상 추가 (노드 익스포터)
# prometheus.yml 수정
cat << EOF >> /etc/prometheus/prometheus.yml

  - job_name: 'node_exporter'
    static_configs:
      - targets: ["127.0.0.1:9200"]
        labels:
          alias: 'myec2'
EOF

# prometheus 데몬 재기동
systemctl restart prometheus.service
systemctl status prometheus
- Prometheus 웹에서 target 확인 및 node로 시작하는 메트릭 질의
rate(node_cpu_seconds_total{mode="system"}[1m])
node_filesystem_avail_bytes
rate(node_network_receive_bytes_total[1m])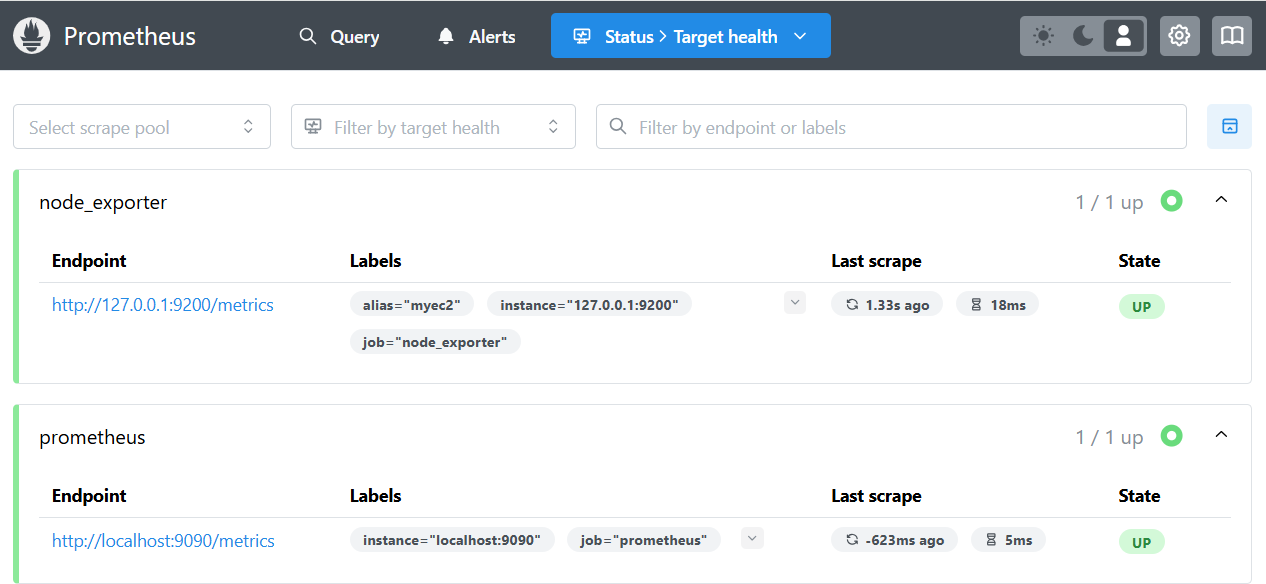

> 프로메테우스-스택 설치 : 모니터링에 필요한 여러 요소를 단일 차트(스택)으로 제공 ← 시각화(그라파나), 이벤트 메시지 정책(경고 임계값/수준) 등
- 위에서 미리 설치 했으므로 이번 챕터에서는 사용방법만 확인
* 삭제 명령어 : helm uninstall -n monitoring kube-prometheus-stack
> AWS CNI Metrics 수집을 위한 설정
# PodMonitor 배포
cat <<EOF | kubectl create -f -
apiVersion: monitoring.coreos.com/v1
kind: PodMonitor
metadata:
  name: aws-cni-metrics
  namespace: kube-system
spec:
  jobLabel: k8s-app
  namespaceSelector:
    matchNames:
    - kube-system
  podMetricsEndpoints:
  - interval: 30s
    path: /metrics
    port: metrics
  selector:
    matchLabels:
      k8s-app: aws-node
EOF

# PodMonitor 확인
kubectl get podmonitor -n kube-system
kubectl get podmonitor -n kube-system aws-cni-metrics -o yaml | kubectl neat

# metrics url 접속 확인
curl -s $N1:61678/metrics | grep '^awscni'
awscni_add_ip_req_count 10
awscni_assigned_ip_addresses 8
awscni_assigned_ip_per_cidr{cidr="192.168.1.117/32"} 1
awscni_assigned_ip_per_cidr{cidr="192.168.1.131/32"} 1
awscni_assigned_ip_per_cidr{cidr="192.168.1.184/32"} 1
awscni_assigned_ip_per_cidr{cidr="192.168.1.210/32"} 0
awscni_assigned_ip_per_cidr{cidr="192.168.1.243/32"} 1
awscni_assigned_ip_per_cidr{cidr="192.168.1.247/32"} 1
awscni_assigned_ip_per_cidr{cidr="192.168.1.38/32"} 1
...

> 프로메테우스 기본 사용
- 모니터링 대상이 되는 서비스는 /metrics 엔드포인트 경로를 통해 메트릭 정보를 노출
- 프로메테우스가 해당 경로에 http get (pull 방식)으로 메트릭 정보를 가져와 TSDB에 저장

* 프로메테우스 Ingress 도메인으로 접속
# ingress 확인
kubectl get ingress -n monitoring kube-prometheus-stack-prometheus
kubectl describe ingress -n monitoring kube-prometheus-stack-prometheus

# 프로메테우스 ingress 도메인으로 웹 접속
echo -e "Prometheus Web URL = https://prometheus.$MyDomain"
open "https://prometheus.$MyDomain" macOS

# 웹 상단 주요 메뉴 설명
1. 쿼리(Query) : 프로메테우스 자체 검색 언어 PromQL을 이용하여 메트릭 정보를 조회 -> 단순한 그래프 형태 조회
2. 경고(Alerts) : 사전에 정의한 시스템 경고 정책(Prometheus Rules)에 대한 상황
3. 상태(Status) : 경고 메시지 정책(Rules), 모니터링 대상(Targets) 등 다양한 프로메테우스 설정 내역을 확인 > 버전 정ㅗ
- Use local time : 출력 시간을 로컬 타임으로 변경
- Enable query history : PromQL 쿼리 히스토리 활성화
- Enable autocomplete : 자동 완성 기능 활성화
- Enable highlighting : 하이라이팅 기능 활성화
- Enable linter : 문법 오류 감지, 자동 코스 스타일 체크
* Statues → 프로메테우스 설정(Configuration) 확인 : Status → Runtime & Build Information 클릭

* Storage retention : 메트릭을 얼마나 저장할 것인가
ex) 5d or 10GiB → 메트릭 저장 기간이 5일 경과 혹은 10GiB 이상 시 오래된 것부터 삭제 ⇒ helm 파라미터에서 수정 가능

* Statues → 프로메테우스 설정(Configuration) 확인 : Status → Command-Line Flags 클릭
- 프로메테우스 기동시 명령어로 오버라이드 가능한 Flag 값

* -log.level : info
* -storage.tsdb.retention.size : 10GiB
* -storage.tsdb.retention.time : 5d
* Statues → 프로메테우스 설정(Configuration) 확인 : Status → Configuration
- 스크랩 설정 확인 (job, label 등) : Job 별로 수집
global:
  scrape_interval: 15s
  scrape_timeout: 10s
  scrape_protocols:
  - OpenMetricsText1.0.0
  - OpenMetricsText0.0.1
  - PrometheusText1.0.0
  - PrometheusText0.0.4
  evaluation_interval: 15s
  external_labels:
    prometheus: monitoring/kube-prometheus-stack-prometheus
    prometheus_replica: prometheus-kube-prometheus-stack-prometheus-0
runtime:
  gogc: 75
rule_files:
- /etc/prometheus/rules/prometheus-kube-prometheus-stack-prometheus-rulefiles-0/*.yaml
scrape_configs:
- job_name: serviceMonitor/monitoring/kube-prometheus-stack-apiserver/0
  honor_timestamps: true
  track_timestamps_staleness: false
  scrape_interval: 15s
  scrape_timeout: 10s
  scrape_protocols:
  - OpenMetricsText1.0.0
  - OpenMetricsText0.0.1
  - PrometheusText1.0.0
  - PrometheusText0.0.4
  metrics_path: /metrics
  scheme: https
  enable_compression: true
  authorization:
    type: Bearer
    credentials_file: /var/run/secrets/kubernetes.io/serviceaccount/token
  tls_config:
    ca_file: /var/run/secrets/kubernetes.io/serviceaccount/ca.crt
    server_name: kubernetes
    insecure_skip_verify: false
  follow_redirects: true
  enable_http2: true
  relabel_configs:
  - source_labels: [job]
    separator: ;
    target_label: __tmp_prometheus_job_name
    replacement: $1
    action: replace
  - source_labels: [__meta_kubernetes_service_label_component, __meta_kubernetes_service_labelpresent_component]
    separator: ;
    regex: (apiserver);true
    replacement: $1
    action: keep
  - source_labels: [__meta_kubernetes_service_label_provider, __meta_kubernetes_service_labelpresent_provider]
    separator: ;
    regex: (kubernetes);true
    replacement: $1
    action: keep
  - source_labels: [__meta_kubernetes_endpoint_port_name]
    separator: ;
    regex: https
    replacement: $1
    action: keep
  - source_labels: [__meta_kubernetes_endpoint_address_target_kind, __meta_kubernetes_endpoint_address_target_name]
    separator: ;
    regex: Node;(.*)
    target_label: node
    replacement: ${1}
    action: replace
  - source_labels: [__meta_kubernetes_endpoint_address_target_kind, __meta_kubernetes_endpoint_address_target_name]
    separator: ;
    regex: Pod;(.*)
    target_label: pod
    replacement: ${1}
    action: replace
  - source_labels: [__meta_kubernetes_namespace]
    separator: ;
    target_label: namespace
    replacement: $1
    action: replace
  - source_labels: [__meta_kubernetes_service_name]
    separator: ;
    target_label: service
    replacement: $1
    action: replace
  - source_labels: [__meta_kubernetes_pod_name]
    separator: ;
    target_label: pod
    replacement: $1
    action: replace
  - source_labels: [__meta_kubernetes_pod_container_name]
    separator: ;
    target_label: container
    replacement: $1
    action: replace
  - source_labels: [__meta_kubernetes_pod_phase]
    separator: ;
    regex: (Failed|Succeeded)
    replacement: $1
    action: drop
  - source_labels: [__meta_kubernetes_service_name]
    separator: ;
    target_label: job
    replacement: ${1}
    action: replace
  - source_labels: [__meta_kubernetes_service_label_component]
    separator: ;
    regex: (.+)
    target_label: job
    replacement: ${1}
    action: replace
  - separator: ;
    target_label: endpoint
    replacement: https
    action: replace
  - source_labels: [__address__, __tmp_hash]
    separator: ;
    regex: (.+);
    target_label: __tmp_hash
    replacement: $1
    action: replace
  - source_labels: [__tmp_hash]
    separator: ;
    modulus: 1
    target_label: __tmp_hash
    replacement: $1
    action: hashmod
  - source_labels: [__tmp_hash]
    separator: ;
    regex: "0"
    replacement: $1
    action: keep
  metric_relabel_configs:
  - source_labels: [__name__, le]
    separator: ;
    regex: (etcd_request|apiserver_request_slo|apiserver_request_sli|apiserver_request)_duration_seconds_bucket;(0\.15|0\.2|0\.3|0\.35|0\.4|0\.45|0\.6|0\.7|0\.8|0\.9|1\.25|1\.5|1\.75|2|3|3\.5|4|4\.5|6|7|8|9|15|20|30|40|45|50)(\.0)?
    replacement: $1
    action: drop
  kubernetes_sd_configs:
  - role: endpoints
    kubeconfig_file: ""
    follow_redirects: true
    enable_http2: true
    namespaces:
      own_namespace: false
      names:
      - default
- job_name: serviceMonitor/monitoring/kube-prometheus-stack-coredns/0
  honor_timestamps: true
  track_timestamps_staleness: false
  scrape_interval: 15s
  scrape_timeout: 10s
  scrape_protocols:
  - OpenMetricsText1.0.0
  - OpenMetricsText0.0.1
  - PrometheusText1.0.0
  - PrometheusText0.0.4
  metrics_path: /metrics
  scheme: http
  enable_compression: true
  authorization:
    type: Bearer
    credentials_file: /var/run/secrets/kubernetes.io/serviceaccount/token
  follow_redirects: true
  enable_http2: true
  relabel_configs:
  - source_labels: [job]
    separator: ;
    target_label: __tmp_prometheus_job_name
    replacement: $1
    action: replace
  - source_labels: [__meta_kubernetes_service_label_app, __meta_kubernetes_service_labelpresent_app]
    separator: ;
    regex: (kube-prometheus-stack-coredns);true
    replacement: $1
    action: keep
  - source_labels: [__meta_kubernetes_service_label_release, __meta_kubernetes_service_labelpresent_release]
    separator: ;
    regex: (kube-prometheus-stack);true
    replacement: $1
    action: keep
  - source_labels: [__meta_kubernetes_endpoint_port_name]
    separator: ;
    regex: http-metrics
    replacement: $1
    action: keep
  - source_labels: [__meta_kubernetes_endpoint_address_target_kind, __meta_kubernetes_endpoint_address_target_name]
    separator: ;
    regex: Node;(.*)
    target_label: node
    replacement: ${1}
    action: replace
  - source_labels: [__meta_kubernetes_endpoint_address_target_kind, __meta_kubernetes_endpoint_address_target_name]
    separator: ;
    regex: Pod;(.*)
    target_label: pod
    replacement: ${1}
    action: replace
  - source_labels: [__meta_kubernetes_namespace]
    separator: ;
    target_label: namespace
    replacement: $1
    action: replace
  - source_labels: [__meta_kubernetes_service_name]
    separator: ;
    target_label: service
    replacement: $1
    action: replace
  - source_labels: [__meta_kubernetes_pod_name]
    separator: ;
    target_label: pod
    replacement: $1
    action: replace
  - source_labels: [__meta_kubernetes_pod_container_name]
    separator: ;
    target_label: container
    replacement: $1
    action: replace
  - source_labels: [__meta_kubernetes_pod_phase]
    separator: ;
    regex: (Failed|Succeeded)
    replacement: $1
    action: drop
  - source_labels: [__meta_kubernetes_service_name]
    separator: ;
    target_label: job
    replacement: ${1}
    action: replace
  - source_labels: [__meta_kubernetes_service_label_jobLabel]
    separator: ;
    regex: (.+)
    target_label: job
    replacement: ${1}
    action: replace
  - separator: ;
    target_label: endpoint
    replacement: http-metrics
    action: replace
  - source_labels: [__address__, __tmp_hash]
    separator: ;
    regex: (.+);
    target_label: __tmp_hash
    replacement: $1
    action: replace
  - source_labels: [__tmp_hash]
    separator: ;
    modulus: 1
    target_label: __tmp_hash
    replacement: $1
    action: hashmod
  - source_labels: [__tmp_hash]
    separator: ;
    regex: "0"
    replacement: $1
    action: keep
  kubernetes_sd_configs:
  - role: endpoints
    kubeconfig_file: ""
    follow_redirects: true
    enable_http2: true
    namespaces:
      own_namespace: false
      names:
      - kube-system
- job_name: serviceMonitor/monitoring/kube-prometheus-stack-kube-proxy/0
  honor_timestamps: true
  track_timestamps_staleness: false
  scrape_interval: 15s
  scrape_timeout: 10s
  scrape_protocols:
  - OpenMetricsText1.0.0
  - OpenMetricsText0.0.1
  - PrometheusText1.0.0
  - PrometheusText0.0.4
  metrics_path: /metrics
  scheme: http
  enable_compression: true
  authorization:
    type: Bearer
    credentials_file: /var/run/secrets/kubernetes.io/serviceaccount/token
  follow_redirects: true
  enable_http2: true
  relabel_configs:
  - source_labels: [job]
    separator: ;
    target_label: __tmp_prometheus_job_name
    replacement: $1
    action: replace
  - source_labels: [__meta_kubernetes_service_label_app, __meta_kubernetes_service_labelpresent_app]
    separator: ;
    regex: (kube-prometheus-stack-kube-proxy);true
    replacement: $1
    action: keep
  - source_labels: [__meta_kubernetes_service_label_release, __meta_kubernetes_service_labelpresent_release]
    separator: ;
    regex: (kube-prometheus-stack);true
    replacement: $1
    action: keep
  - source_labels: [__meta_kubernetes_endpoint_port_name]
    separator: ;
    regex: http-metrics
    replacement: $1
    action: keep
  - source_labels: [__meta_kubernetes_endpoint_address_target_kind, __meta_kubernetes_endpoint_address_target_name]
    separator: ;
    regex: Node;(.*)
    target_label: node
    replacement: ${1}
    action: replace
  - source_labels: [__meta_kubernetes_endpoint_address_target_kind, __meta_kubernetes_endpoint_address_target_name]
    separator: ;
    regex: Pod;(.*)
    target_label: pod
    replacement: ${1}
    action: replace
  - source_labels: [__meta_kubernetes_namespace]
    separator: ;
    target_label: namespace
    replacement: $1
    action: replace
  - source_labels: [__meta_kubernetes_service_name]
    separator: ;
    target_label: service
    replacement: $1
    action: replace
  - source_labels: [__meta_kubernetes_pod_name]
    separator: ;
    target_label: pod
    replacement: $1
    action: replace
  - source_labels: [__meta_kubernetes_pod_container_name]
    separator: ;
    target_label: container
    replacement: $1
    action: replace
  - source_labels: [__meta_kubernetes_pod_phase]
    separator: ;
    regex: (Failed|Succeeded)
    replacement: $1
    action: drop
  - source_labels: [__meta_kubernetes_service_name]
    separator: ;
    target_label: job
    replacement: ${1}
    action: replace
  - source_labels: [__meta_kubernetes_service_label_jobLabel]
    separator: ;
    regex: (.+)
    target_label: job
    replacement: ${1}
    action: replace
  - separator: ;
    target_label: endpoint
    replacement: http-metrics
    action: replace
  - source_labels: [__address__, __tmp_hash]
    separator: ;
    regex: (.+);
    target_label: __tmp_hash
    replacement: $1
    action: replace
  - source_labels: [__tmp_hash]
    separator: ;
    modulus: 1
    target_label: __tmp_hash
    replacement: $1
    action: hashmod
  - source_labels: [__tmp_hash]
    separator: ;
    regex: "0"
    replacement: $1
    action: keep
  kubernetes_sd_configs:
  - role: endpoints
    kubeconfig_file: ""
    follow_redirects: true
    enable_http2: true
    namespaces:
      own_namespace: false
      names:
      - kube-system
- job_name: serviceMonitor/monitoring/kube-prometheus-stack-kube-state-metrics/0
  honor_labels: true
  honor_timestamps: true
  track_timestamps_staleness: false
  scrape_interval: 15s
  scrape_timeout: 10s
  scrape_protocols:
  - OpenMetricsText1.0.0
  - OpenMetricsText0.0.1
  - PrometheusText1.0.0
  - PrometheusText0.0.4
  metrics_path: /metrics
  scheme: http
  enable_compression: true
  follow_redirects: true
  enable_http2: true
  relabel_configs:
  - source_labels: [job]
    separator: ;
    target_label: __tmp_prometheus_job_name
    replacement: $1
    action: replace
  - source_labels: [__meta_kubernetes_service_label_app_kubernetes_io_instance, __meta_kubernetes_service_labelpresent_app_kubernetes_io_instance]
    separator: ;
    regex: (kube-prometheus-stack);true
    replacement: $1
    action: keep
  - source_labels: [__meta_kubernetes_service_label_app_kubernetes_io_name, __meta_kubernetes_service_labelpresent_app_kubernetes_io_name]
    separator: ;
    regex: (kube-state-metrics);true
    replacement: $1
    action: keep
  - source_labels: [__meta_kubernetes_endpoint_port_name]
    separator: ;
    regex: http
    replacement: $1
    action: keep
  - source_labels: [__meta_kubernetes_endpoint_address_target_kind, __meta_kubernetes_endpoint_address_target_name]
    separator: ;
    regex: Node;(.*)
    target_label: node
    replacement: ${1}
    action: replace
  - source_labels: [__meta_kubernetes_endpoint_address_target_kind, __meta_kubernetes_endpoint_address_target_name]
    separator: ;
    regex: Pod;(.*)
    target_label: pod
    replacement: ${1}
    action: replace
  - source_labels: [__meta_kubernetes_namespace]
    separator: ;
    target_label: namespace
    replacement: $1
    action: replace
  - source_labels: [__meta_kubernetes_service_name]
    separator: ;
    target_label: service
    replacement: $1
    action: replace
  - source_labels: [__meta_kubernetes_pod_name]
    separator: ;
    target_label: pod
    replacement: $1
    action: replace
  - source_labels: [__meta_kubernetes_pod_container_name]
    separator: ;
    target_label: container
    replacement: $1
    action: replace
  - source_labels: [__meta_kubernetes_pod_phase]
    separator: ;
    regex: (Failed|Succeeded)
    replacement: $1
    action: drop
  - source_labels: [__meta_kubernetes_service_name]
    separator: ;
    target_label: job
    replacement: ${1}
    action: replace
  - source_labels: [__meta_kubernetes_service_label_app_kubernetes_io_name]
    separator: ;
    regex: (.+)
    target_label: job
    replacement: ${1}
    action: replace
  - separator: ;
    target_label: endpoint
    replacement: http
    action: replace
  - source_labels: [__address__, __tmp_hash]
    separator: ;
    regex: (.+);
    target_label: __tmp_hash
    replacement: $1
    action: replace
  - source_labels: [__tmp_hash]
    separator: ;
    modulus: 1
    target_label: __tmp_hash
    replacement: $1
    action: hashmod
  - source_labels: [__tmp_hash]
    separator: ;
    regex: "0"
    replacement: $1
    action: keep
  kubernetes_sd_configs:
  - role: endpoints
    kubeconfig_file: ""
    follow_redirects: true
    enable_http2: true
    namespaces:
      own_namespace: false
      names:
      - monitoring
- job_name: serviceMonitor/monitoring/kube-prometheus-stack-kubelet/0
  honor_labels: true
  honor_timestamps: true
  track_timestamps_staleness: false
  scrape_interval: 15s
  scrape_timeout: 10s
  scrape_protocols:
  - OpenMetricsText1.0.0
  - OpenMetricsText0.0.1
  - PrometheusText1.0.0
  - PrometheusText0.0.4
  metrics_path: /metrics
  scheme: https
  enable_compression: true
  authorization:
    type: Bearer
    credentials_file: /var/run/secrets/kubernetes.io/serviceaccount/token
  tls_config:
    ca_file: /var/run/secrets/kubernetes.io/serviceaccount/ca.crt
    insecure_skip_verify: true
  follow_redirects: true
  enable_http2: true
  relabel_configs:
  - source_labels: [job]
    separator: ;
    target_label: __tmp_prometheus_job_name
    replacement: $1
    action: replace
  - source_labels: [__meta_kubernetes_service_label_app_kubernetes_io_name, __meta_kubernetes_service_labelpresent_app_kubernetes_io_name]
    separator: ;
    regex: (kubelet);true
    replacement: $1
    action: keep
  - source_labels: [__meta_kubernetes_service_label_k8s_app, __meta_kubernetes_service_labelpresent_k8s_app]
    separator: ;
    regex: (kubelet);true
    replacement: $1
    action: keep
  - source_labels: [__meta_kubernetes_endpoint_port_name]
    separator: ;
    regex: https-metrics
    replacement: $1
    action: keep
  - source_labels: [__meta_kubernetes_endpoint_address_target_kind, __meta_kubernetes_endpoint_address_target_name]
    separator: ;
    regex: Node;(.*)
    target_label: node
    replacement: ${1}
    action: replace
  - source_labels: [__meta_kubernetes_endpoint_address_target_kind, __meta_kubernetes_endpoint_address_target_name]
    separator: ;
    regex: Pod;(.*)
    target_label: pod
    replacement: ${1}
    action: replace
  - source_labels: [__meta_kubernetes_namespace]
    separator: ;
    target_label: namespace
    replacement: $1
    action: replace
  - source_labels: [__meta_kubernetes_service_name]
    separator: ;
    target_label: service
    replacement: $1
    action: replace
  - source_labels: [__meta_kubernetes_pod_name]
    separator: ;
    target_label: pod
    replacement: $1
    action: replace
  - source_labels: [__meta_kubernetes_pod_container_name]
    separator: ;
    target_label: container
    replacement: $1
    action: replace
  - source_labels: [__meta_kubernetes_pod_phase]
    separator: ;
    regex: (Failed|Succeeded)
    replacement: $1
    action: drop
  - source_labels: [__meta_kubernetes_service_name]
    separator: ;
    target_label: job
    replacement: ${1}
    action: replace
  - source_labels: [__meta_kubernetes_service_label_k8s_app]
    separator: ;
    regex: (.+)
    target_label: job
    replacement: ${1}
    action: replace
  - separator: ;
    target_label: endpoint
    replacement: https-metrics
    action: replace
  - source_labels: [__metrics_path__]
    separator: ;
    target_label: metrics_path
    replacement: $1
    action: replace
  - source_labels: [__address__, __tmp_hash]
    separator: ;
    regex: (.+);
    target_label: __tmp_hash
    replacement: $1
    action: replace
  - source_labels: [__tmp_hash]
    separator: ;
    modulus: 1
    target_label: __tmp_hash
    replacement: $1
    action: hashmod
  - source_labels: [__tmp_hash]
    separator: ;
    regex: "0"
    replacement: $1
    action: keep
  metric_relabel_configs:
  - source_labels: [__name__, le]
    separator: ;
    regex: (csi_operations|storage_operation_duration)_seconds_bucket;(0.25|2.5|15|25|120|600)(\.0)?
    replacement: $1
    action: drop
  kubernetes_sd_configs:
  - role: endpoints
    kubeconfig_file: ""
    follow_redirects: true
    enable_http2: true
    namespaces:
      own_namespace: false
      names:
      - kube-system
- job_name: serviceMonitor/monitoring/kube-prometheus-stack-kubelet/1
  honor_labels: true
  honor_timestamps: true
  track_timestamps_staleness: true
  scrape_interval: 10s
  scrape_timeout: 10s
  scrape_protocols:
  - OpenMetricsText1.0.0
  - OpenMetricsText0.0.1
  - PrometheusText1.0.0
  - PrometheusText0.0.4
  metrics_path: /metrics/cadvisor
  scheme: https
  enable_compression: true
  authorization:
    type: Bearer
    credentials_file: /var/run/secrets/kubernetes.io/serviceaccount/token
  tls_config:
    ca_file: /var/run/secrets/kubernetes.io/serviceaccount/ca.crt
    insecure_skip_verify: true
  follow_redirects: true
  enable_http2: true
  relabel_configs:
  - source_labels: [job]
    separator: ;
    target_label: __tmp_prometheus_job_name
    replacement: $1
    action: replace
  - source_labels: [__meta_kubernetes_service_label_app_kubernetes_io_name, __meta_kubernetes_service_labelpresent_app_kubernetes_io_name]
    separator: ;
    regex: (kubelet);true
    replacement: $1
    action: keep
  - source_labels: [__meta_kubernetes_service_label_k8s_app, __meta_kubernetes_service_labelpresent_k8s_app]
    separator: ;
    regex: (kubelet);true
    replacement: $1
    action: keep
  - source_labels: [__meta_kubernetes_endpoint_port_name]
    separator: ;
    regex: https-metrics
    replacement: $1
    action: keep
  - source_labels: [__meta_kubernetes_endpoint_address_target_kind, __meta_kubernetes_endpoint_address_target_name]
    separator: ;
    regex: Node;(.*)
    target_label: node
    replacement: ${1}
    action: replace
  - source_labels: [__meta_kubernetes_endpoint_address_target_kind, __meta_kubernetes_endpoint_address_target_name]
    separator: ;
    regex: Pod;(.*)
    target_label: pod
    replacement: ${1}
    action: replace
  - source_labels: [__meta_kubernetes_namespace]
    separator: ;
    target_label: namespace
    replacement: $1
    action: replace
  - source_labels: [__meta_kubernetes_service_name]
    separator: ;
    target_label: service
    replacement: $1
    action: replace
  - source_labels: [__meta_kubernetes_pod_name]
    separator: ;
    target_label: pod
    replacement: $1
    action: replace
  - source_labels: [__meta_kubernetes_pod_container_name]
    separator: ;
    target_label: container
    replacement: $1
    action: replace
  - source_labels: [__meta_kubernetes_pod_phase]
    separator: ;
    regex: (Failed|Succeeded)
    replacement: $1
    action: drop
  - source_labels: [__meta_kubernetes_service_name]
    separator: ;
    target_label: job
    replacement: ${1}
    action: replace
  - source_labels: [__meta_kubernetes_service_label_k8s_app]
    separator: ;
    regex: (.+)
    target_label: job
    replacement: ${1}
    action: replace
  - separator: ;
    target_label: endpoint
    replacement: https-metrics
    action: replace
  - source_labels: [__metrics_path__]
    separator: ;
    target_label: metrics_path
    replacement: $1
    action: replace
  - source_labels: [__address__, __tmp_hash]
    separator: ;
    regex: (.+);
    target_label: __tmp_hash
    replacement: $1
    action: replace
  - source_labels: [__tmp_hash]
    separator: ;
    modulus: 1
    target_label: __tmp_hash
    replacement: $1
    action: hashmod
  - source_labels: [__tmp_hash]
    separator: ;
    regex: "0"
    replacement: $1
    action: keep
  metric_relabel_configs:
  - source_labels: [__name__]
    separator: ;
    regex: container_cpu_(cfs_throttled_seconds_total|load_average_10s|system_seconds_total|user_seconds_total)
    replacement: $1
    action: drop
  - source_labels: [__name__]
    separator: ;
    regex: container_fs_(io_current|io_time_seconds_total|io_time_weighted_seconds_total|reads_merged_total|sector_reads_total|sector_writes_total|writes_merged_total)
    replacement: $1
    action: drop
  - source_labels: [__name__]
    separator: ;
    regex: container_memory_(mapped_file|swap)
    replacement: $1
    action: drop
  - source_labels: [__name__]
    separator: ;
    regex: container_(file_descriptors|tasks_state|threads_max)
    replacement: $1
    action: drop
  - source_labels: [__name__, scope]
    separator: ;
    regex: container_memory_failures_total;hierarchy
    replacement: $1
    action: drop
  - source_labels: [__name__, interface]
    separator: ;
    regex: container_network_.*;(cali|cilium|cni|lxc|nodelocaldns|tunl).*
    replacement: $1
    action: drop
  - source_labels: [__name__]
    separator: ;
    regex: container_spec.*
    replacement: $1
    action: drop
  - source_labels: [id, pod]
    separator: ;
    regex: .+;
    replacement: $1
    action: drop
  kubernetes_sd_configs:
  - role: endpoints
    kubeconfig_file: ""
    follow_redirects: true
    enable_http2: true
    namespaces:
      own_namespace: false
      names:
      - kube-system
- job_name: serviceMonitor/monitoring/kube-prometheus-stack-kubelet/2
  honor_labels: true
  honor_timestamps: true
  track_timestamps_staleness: false
  scrape_interval: 15s
  scrape_timeout: 10s
  scrape_protocols:
  - OpenMetricsText1.0.0
  - OpenMetricsText0.0.1
  - PrometheusText1.0.0
  - PrometheusText0.0.4
  metrics_path: /metrics/probes
  scheme: https
  enable_compression: true
  authorization:
    type: Bearer
    credentials_file: /var/run/secrets/kubernetes.io/serviceaccount/token
  tls_config:
    ca_file: /var/run/secrets/kubernetes.io/serviceaccount/ca.crt
    insecure_skip_verify: true
  follow_redirects: true
  enable_http2: true
  relabel_configs:
  - source_labels: [job]
    separator: ;
    target_label: __tmp_prometheus_job_name
    replacement: $1
    action: replace
  - source_labels: [__meta_kubernetes_service_label_app_kubernetes_io_name, __meta_kubernetes_service_labelpresent_app_kubernetes_io_name]
    separator: ;
    regex: (kubelet);true
    replacement: $1
    action: keep
  - source_labels: [__meta_kubernetes_service_label_k8s_app, __meta_kubernetes_service_labelpresent_k8s_app]
    separator: ;
    regex: (kubelet);true
    replacement: $1
    action: keep
  - source_labels: [__meta_kubernetes_endpoint_port_name]
    separator: ;
    regex: https-metrics
    replacement: $1
    action: keep
  - source_labels: [__meta_kubernetes_endpoint_address_target_kind, __meta_kubernetes_endpoint_address_target_name]
    separator: ;
    regex: Node;(.*)
    target_label: node
    replacement: ${1}
    action: replace
  - source_labels: [__meta_kubernetes_endpoint_address_target_kind, __meta_kubernetes_endpoint_address_target_name]
    separator: ;
    regex: Pod;(.*)
    target_label: pod
    replacement: ${1}
    action: replace
  - source_labels: [__meta_kubernetes_namespace]
    separator: ;
    target_label: namespace
    replacement: $1
    action: replace
  - source_labels: [__meta_kubernetes_service_name]
    separator: ;
    target_label: service
    replacement: $1
    action: replace
  - source_labels: [__meta_kubernetes_pod_name]
    separator: ;
    target_label: pod
    replacement: $1
    action: replace
  - source_labels: [__meta_kubernetes_pod_container_name]
    separator: ;
    target_label: container
    replacement: $1
    action: replace
  - source_labels: [__meta_kubernetes_pod_phase]
    separator: ;
    regex: (Failed|Succeeded)
    replacement: $1
    action: drop
  - source_labels: [__meta_kubernetes_service_name]
    separator: ;
    target_label: job
    replacement: ${1}
    action: replace
  - source_labels: [__meta_kubernetes_service_label_k8s_app]
    separator: ;
    regex: (.+)
    target_label: job
    replacement: ${1}
    action: replace
  - separator: ;
    target_label: endpoint
    replacement: https-metrics
    action: replace
  - source_labels: [__metrics_path__]
    separator: ;
    target_label: metrics_path
    replacement: $1
    action: replace
  - source_labels: [__address__, __tmp_hash]
    separator: ;
    regex: (.+);
    target_label: __tmp_hash
    replacement: $1
    action: replace
  - source_labels: [__tmp_hash]
    separator: ;
    modulus: 1
    target_label: __tmp_hash
    replacement: $1
    action: hashmod
  - source_labels: [__tmp_hash]
    separator: ;
    regex: "0"
    replacement: $1
    action: keep
  kubernetes_sd_configs:
  - role: endpoints
    kubeconfig_file: ""
    follow_redirects: true
    enable_http2: true
    namespaces:
      own_namespace: false
      names:
      - kube-system
- job_name: serviceMonitor/monitoring/kube-prometheus-stack-operator/0
  honor_labels: true
  honor_timestamps: true
  track_timestamps_staleness: false
  scrape_interval: 15s
  scrape_timeout: 10s
  scrape_protocols:
  - OpenMetricsText1.0.0
  - OpenMetricsText0.0.1
  - PrometheusText1.0.0
  - PrometheusText0.0.4
  metrics_path: /metrics
  scheme: https
  enable_compression: true
  tls_config:
    ca_file: /etc/prometheus/certs/0_monitoring_kube-prometheus-stack-admission_ca
    server_name: kube-prometheus-stack-operator
    insecure_skip_verify: false
  follow_redirects: true
  enable_http2: true
  relabel_configs:
  - source_labels: [job]
    separator: ;
    target_label: __tmp_prometheus_job_name
    replacement: $1
    action: replace
  - source_labels: [__meta_kubernetes_service_label_app, __meta_kubernetes_service_labelpresent_app]
    separator: ;
    regex: (kube-prometheus-stack-operator);true
    replacement: $1
    action: keep
  - source_labels: [__meta_kubernetes_service_label_release, __meta_kubernetes_service_labelpresent_release]
    separator: ;
    regex: (kube-prometheus-stack);true
    replacement: $1
    action: keep
  - source_labels: [__meta_kubernetes_endpoint_port_name]
    separator: ;
    regex: https
    replacement: $1
    action: keep
  - source_labels: [__meta_kubernetes_endpoint_address_target_kind, __meta_kubernetes_endpoint_address_target_name]
    separator: ;
    regex: Node;(.*)
    target_label: node
    replacement: ${1}
    action: replace
  - source_labels: [__meta_kubernetes_endpoint_address_target_kind, __meta_kubernetes_endpoint_address_target_name]
    separator: ;
    regex: Pod;(.*)
    target_label: pod
    replacement: ${1}
    action: replace
  - source_labels: [__meta_kubernetes_namespace]
    separator: ;
    target_label: namespace
    replacement: $1
    action: replace
  - source_labels: [__meta_kubernetes_service_name]
    separator: ;
    target_label: service
    replacement: $1
    action: replace
  - source_labels: [__meta_kubernetes_pod_name]
    separator: ;
    target_label: pod
    replacement: $1
    action: replace
  - source_labels: [__meta_kubernetes_pod_container_name]
    separator: ;
    target_label: container
    replacement: $1
    action: replace
  - source_labels: [__meta_kubernetes_pod_phase]
    separator: ;
    regex: (Failed|Succeeded)
    replacement: $1
    action: drop
  - source_labels: [__meta_kubernetes_service_name]
    separator: ;
    target_label: job
    replacement: ${1}
    action: replace
  - separator: ;
    target_label: endpoint
    replacement: https
    action: replace
  - source_labels: [__address__, __tmp_hash]
    separator: ;
    regex: (.+);
    target_label: __tmp_hash
    replacement: $1
    action: replace
  - source_labels: [__tmp_hash]
    separator: ;
    modulus: 1
    target_label: __tmp_hash
    replacement: $1
    action: hashmod
  - source_labels: [__tmp_hash]
    separator: ;
    regex: "0"
    replacement: $1
    action: keep
  kubernetes_sd_configs:
  - role: endpoints
    kubeconfig_file: ""
    follow_redirects: true
    enable_http2: true
    namespaces:
      own_namespace: false
      names:
      - monitoring
- job_name: serviceMonitor/monitoring/kube-prometheus-stack-prometheus/0
  honor_timestamps: true
  track_timestamps_staleness: false
  scrape_interval: 15s
  scrape_timeout: 10s
  scrape_protocols:
  - OpenMetricsText1.0.0
  - OpenMetricsText0.0.1
  - PrometheusText1.0.0
  - PrometheusText0.0.4
  metrics_path: /metrics
  scheme: http
  enable_compression: true
  follow_redirects: true
  enable_http2: true
  relabel_configs:
  - source_labels: [job]
    separator: ;
    target_label: __tmp_prometheus_job_name
    replacement: $1
    action: replace
  - source_labels: [__meta_kubernetes_service_label_app, __meta_kubernetes_service_labelpresent_app]
    separator: ;
    regex: (kube-prometheus-stack-prometheus);true
    replacement: $1
    action: keep
  - source_labels: [__meta_kubernetes_service_label_release, __meta_kubernetes_service_labelpresent_release]
    separator: ;
    regex: (kube-prometheus-stack);true
    replacement: $1
    action: keep
  - source_labels: [__meta_kubernetes_service_label_self_monitor, __meta_kubernetes_service_labelpresent_self_monitor]
    separator: ;
    regex: (true);true
    replacement: $1
    action: keep
  - source_labels: [__meta_kubernetes_endpoint_port_name]
    separator: ;
    regex: http-web
    replacement: $1
    action: keep
  - source_labels: [__meta_kubernetes_endpoint_address_target_kind, __meta_kubernetes_endpoint_address_target_name]
    separator: ;
    regex: Node;(.*)
    target_label: node
    replacement: ${1}
    action: replace
  - source_labels: [__meta_kubernetes_endpoint_address_target_kind, __meta_kubernetes_endpoint_address_target_name]
    separator: ;
    regex: Pod;(.*)
    target_label: pod
    replacement: ${1}
    action: replace
  - source_labels: [__meta_kubernetes_namespace]
    separator: ;
    target_label: namespace
    replacement: $1
    action: replace
  - source_labels: [__meta_kubernetes_service_name]
    separator: ;
    target_label: service
    replacement: $1
    action: replace
  - source_labels: [__meta_kubernetes_pod_name]
    separator: ;
    target_label: pod
    replacement: $1
    action: replace
  - source_labels: [__meta_kubernetes_pod_container_name]
    separator: ;
    target_label: container
    replacement: $1
    action: replace
  - source_labels: [__meta_kubernetes_pod_phase]
    separator: ;
    regex: (Failed|Succeeded)
    replacement: $1
    action: drop
  - source_labels: [__meta_kubernetes_service_name]
    separator: ;
    target_label: job
    replacement: ${1}
    action: replace
  - separator: ;
    target_label: endpoint
    replacement: http-web
    action: replace
  - source_labels: [__address__, __tmp_hash]
    separator: ;
    regex: (.+);
    target_label: __tmp_hash
    replacement: $1
    action: replace
  - source_labels: [__tmp_hash]
    separator: ;
    modulus: 1
    target_label: __tmp_hash
    replacement: $1
    action: hashmod
  - source_labels: [__tmp_hash]
    separator: ;
    regex: "0"
    replacement: $1
    action: keep
  kubernetes_sd_configs:
  - role: endpoints
    kubeconfig_file: ""
    follow_redirects: true
    enable_http2: true
    namespaces:
      own_namespace: false
      names:
      - monitoring
- job_name: serviceMonitor/monitoring/kube-prometheus-stack-prometheus/1
  honor_timestamps: true
  track_timestamps_staleness: false
  scrape_interval: 15s
  scrape_timeout: 10s
  scrape_protocols:
  - OpenMetricsText1.0.0
  - OpenMetricsText0.0.1
  - PrometheusText1.0.0
  - PrometheusText0.0.4
  metrics_path: /metrics
  scheme: http
  enable_compression: true
  follow_redirects: true
  enable_http2: true
  relabel_configs:
  - source_labels: [job]
    separator: ;
    target_label: __tmp_prometheus_job_name
    replacement: $1
    action: replace
  - source_labels: [__meta_kubernetes_service_label_app, __meta_kubernetes_service_labelpresent_app]
    separator: ;
    regex: (kube-prometheus-stack-prometheus);true
    replacement: $1
    action: keep
  - source_labels: [__meta_kubernetes_service_label_release, __meta_kubernetes_service_labelpresent_release]
    separator: ;
    regex: (kube-prometheus-stack);true
    replacement: $1
    action: keep
  - source_labels: [__meta_kubernetes_service_label_self_monitor, __meta_kubernetes_service_labelpresent_self_monitor]
    separator: ;
    regex: (true);true
    replacement: $1
    action: keep
  - source_labels: [__meta_kubernetes_endpoint_port_name]
    separator: ;
    regex: reloader-web
    replacement: $1
    action: keep
  - source_labels: [__meta_kubernetes_endpoint_address_target_kind, __meta_kubernetes_endpoint_address_target_name]
    separator: ;
    regex: Node;(.*)
    target_label: node
    replacement: ${1}
    action: replace
  - source_labels: [__meta_kubernetes_endpoint_address_target_kind, __meta_kubernetes_endpoint_address_target_name]
    separator: ;
    regex: Pod;(.*)
    target_label: pod
    replacement: ${1}
    action: replace
  - source_labels: [__meta_kubernetes_namespace]
    separator: ;
    target_label: namespace
    replacement: $1
    action: replace
  - source_labels: [__meta_kubernetes_service_name]
    separator: ;
    target_label: service
    replacement: $1
    action: replace
  - source_labels: [__meta_kubernetes_pod_name]
    separator: ;
    target_label: pod
    replacement: $1
    action: replace
  - source_labels: [__meta_kubernetes_pod_container_name]
    separator: ;
    target_label: container
    replacement: $1
    action: replace
  - source_labels: [__meta_kubernetes_pod_phase]
    separator: ;
    regex: (Failed|Succeeded)
    replacement: $1
    action: drop
  - source_labels: [__meta_kubernetes_service_name]
    separator: ;
    target_label: job
    replacement: ${1}
    action: replace
  - separator: ;
    target_label: endpoint
    replacement: reloader-web
    action: replace
  - source_labels: [__address__, __tmp_hash]
    separator: ;
    regex: (.+);
    target_label: __tmp_hash
    replacement: $1
    action: replace
  - source_labels: [__tmp_hash]
    separator: ;
    modulus: 1
    target_label: __tmp_hash
    replacement: $1
    action: hashmod
  - source_labels: [__tmp_hash]
    separator: ;
    regex: "0"
    replacement: $1
    action: keep
  kubernetes_sd_configs:
  - role: endpoints
    kubeconfig_file: ""
    follow_redirects: true
    enable_http2: true
    namespaces:
      own_namespace: false
      names:
      - monitoring
- job_name: serviceMonitor/monitoring/kube-prometheus-stack-prometheus-node-exporter/0
  honor_timestamps: true
  track_timestamps_staleness: false
  scrape_interval: 15s
  scrape_timeout: 10s
  scrape_protocols:
  - OpenMetricsText1.0.0
  - OpenMetricsText0.0.1
  - PrometheusText1.0.0
  - PrometheusText0.0.4
  metrics_path: /metrics
  scheme: http
  enable_compression: true
  follow_redirects: true
  enable_http2: true
  relabel_configs:
  - source_labels: [job]
    separator: ;
    target_label: __tmp_prometheus_job_name
    replacement: $1
    action: replace
  - source_labels: [__meta_kubernetes_service_label_app_kubernetes_io_instance, __meta_kubernetes_service_labelpresent_app_kubernetes_io_instance]
    separator: ;
    regex: (kube-prometheus-stack);true
    replacement: $1
    action: keep
  - source_labels: [__meta_kubernetes_service_label_app_kubernetes_io_name, __meta_kubernetes_service_labelpresent_app_kubernetes_io_name]
    separator: ;
    regex: (prometheus-node-exporter);true
    replacement: $1
    action: keep
  - source_labels: [__meta_kubernetes_endpoint_port_name]
    separator: ;
    regex: http-metrics
    replacement: $1
    action: keep
  - source_labels: [__meta_kubernetes_endpoint_address_target_kind, __meta_kubernetes_endpoint_address_target_name]
    separator: ;
    regex: Node;(.*)
    target_label: node
    replacement: ${1}
    action: replace
  - source_labels: [__meta_kubernetes_endpoint_address_target_kind, __meta_kubernetes_endpoint_address_target_name]
    separator: ;
    regex: Pod;(.*)
    target_label: pod
    replacement: ${1}
    action: replace
  - source_labels: [__meta_kubernetes_namespace]
    separator: ;
    target_label: namespace
    replacement: $1
    action: replace
  - source_labels: [__meta_kubernetes_service_name]
    separator: ;
    target_label: service
    replacement: $1
    action: replace
  - source_labels: [__meta_kubernetes_pod_name]
    separator: ;
    target_label: pod
    replacement: $1
    action: replace
  - source_labels: [__meta_kubernetes_pod_container_name]
    separator: ;
    target_label: container
    replacement: $1
    action: replace
  - source_labels: [__meta_kubernetes_pod_phase]
    separator: ;
    regex: (Failed|Succeeded)
    replacement: $1
    action: drop
  - source_labels: [__meta_kubernetes_service_name]
    separator: ;
    target_label: job
    replacement: ${1}
    action: replace
  - source_labels: [__meta_kubernetes_service_label_jobLabel]
    separator: ;
    regex: (.+)
    target_label: job
    replacement: ${1}
    action: replace
  - separator: ;
    target_label: endpoint
    replacement: http-metrics
    action: replace
  - source_labels: [__address__, __tmp_hash]
    separator: ;
    regex: (.+);
    target_label: __tmp_hash
    replacement: $1
    action: replace
  - source_labels: [__tmp_hash]
    separator: ;
    modulus: 1
    target_label: __tmp_hash
    replacement: $1
    action: hashmod
  - source_labels: [__tmp_hash]
    separator: ;
    regex: "0"
    replacement: $1
    action: keep
  kubernetes_sd_configs:
  - role: endpoints
    kubeconfig_file: ""
    follow_redirects: true
    enable_http2: true
    namespaces:
      own_namespace: false
      names:
      - monitoring
- job_name: podMonitor/kube-system/aws-cni-metrics/0
  honor_timestamps: true
  track_timestamps_staleness: false
  scrape_interval: 30s
  scrape_timeout: 10s
  scrape_protocols:
  - OpenMetricsText1.0.0
  - OpenMetricsText0.0.1
  - PrometheusText1.0.0
  - PrometheusText0.0.4
  metrics_path: /metrics
  scheme: http
  enable_compression: true
  follow_redirects: true
  enable_http2: true
  relabel_configs:
  - source_labels: [job]
    separator: ;
    target_label: __tmp_prometheus_job_name
    replacement: $1
    action: replace
  - source_labels: [__meta_kubernetes_pod_phase]
    separator: ;
    regex: (Failed|Succeeded)
    replacement: $1
    action: drop
  - source_labels: [__meta_kubernetes_pod_label_k8s_app, __meta_kubernetes_pod_labelpresent_k8s_app]
    separator: ;
    regex: (aws-node);true
    replacement: $1
    action: keep
  - source_labels: [__meta_kubernetes_pod_container_port_name]
    separator: ;
    regex: metrics
    replacement: $1
    action: keep
  - source_labels: [__meta_kubernetes_namespace]
    separator: ;
    target_label: namespace
    replacement: $1
    action: replace
  - source_labels: [__meta_kubernetes_pod_container_name]
    separator: ;
    target_label: container
    replacement: $1
    action: replace
  - source_labels: [__meta_kubernetes_pod_name]
    separator: ;
    target_label: pod
    replacement: $1
    action: replace
  - separator: ;
    target_label: job
    replacement: kube-system/aws-cni-metrics
    action: replace
  - source_labels: [__meta_kubernetes_pod_label_k8s_app]
    separator: ;
    regex: (.+)
    target_label: job
    replacement: ${1}
    action: replace
  - separator: ;
    target_label: endpoint
    replacement: metrics
    action: replace
  - source_labels: [__address__, __tmp_hash]
    separator: ;
    regex: (.+);
    target_label: __tmp_hash
    replacement: $1
    action: replace
  - source_labels: [__tmp_hash]
    separator: ;
    modulus: 1
    target_label: __tmp_hash
    replacement: $1
    action: hashmod
  - source_labels: [__tmp_hash]
    separator: ;
    regex: "0"
    replacement: $1
    action: keep
  kubernetes_sd_configs:
  - role: pod
    kubeconfig_file: ""
    follow_redirects: true
    enable_http2: true
    namespaces:
      own_namespace: false
      names:
      - kube-system
storage:
  tsdb:
    outofordertimewindow: 0
* 전체 메트릭 대상 확인 : Status -> Target Health

. 각 Target 클릭 시 메트릭 정보 확인 가능
# serviceMonitor/monitoring/kube-prometheus-stack-kube-proxy/0 (3/3 up) 중 노드1에 Endpoint 접속 확인 (접속 주소는 실습 환경에 따라 다름)
ssh $N1 curl -s http://localhost:10249/metrics
rest_client_response_size_bytes_bucket{host="006fc3f3f0730a7fb3fdb3181f546281.gr7.ap-northeast-2.eks.amazonaws.com",verb="POST",le="4.194304e+06"} 1
rest_client_response_size_bytes_bucket{host="006fc3f3f0730a7fb3fdb3181f546281.gr7.ap-northeast-2.eks.amazonaws.com",verb="POST",le="1.6777216e+07"} 1
rest_client_response_size_bytes_bucket{host="006fc3f3f0730a7fb3fdb3181f546281.gr7.ap-northeast-2.eks.amazonaws.com",verb="POST",le="+Inf"} 1
rest_client_response_size_bytes_sum{host="006fc3f3f0730a7fb3fdb3181f546281.gr7.ap-northeast-2.eks.amazonaws.com",verb="POST"} 626
rest_client_response_size_bytes_count{host="006fc3f3f0730a7fb3fdb3181f546281.gr7.ap-northeast-2.eks.amazonaws.com",verb="POST"} 1
...

# [운영서버 EC2] serviceMonitor/monitoring/kube-prometheus-stack-api-server/0 (2/2 up) 중 Endpoint 접속 확인 (접속 주소는 실습 환경에 따라 다름)
>> 해당 IP주소는 어디인가요?, 왜 apiserver endpoint는 2개뿐인가요? , 아래 메트릭 수집이 되게 하기 위해서는 어떻게 하면 될까요?
curl -s https://192.168.1.53/metrics | tail -n 5
...

# [운영서버 EC2] 그외 다른 타켓의 Endpoint 로 접속 확인 가능 : 예시) 아래는 coredns 의 Endpoint 주소 (접속 주소는 실습 환경에 따라 다름)
curl -s http://192.168.1.75:9153/metrics | tail -n 5
# TYPE process_virtual_memory_bytes gauge
process_virtual_memory_bytes 7.79350016e+08
# HELP process_virtual_memory_max_bytes Maximum amount of virtual memory available in bytes.
# TYPE process_virtual_memory_max_bytes gauge
process_virtual_memory_max_bytes 1.8446744073709552e+19
* 프로메테우스 설정(Configuration) 확인 : Status → Service Discovery : 모든 endpoint 로 도달 가능 시 자동 발견!, 도달 규칙은 설정Configuration 파일에 정의
- Pod 모니터 : label 기반
- 서비스 모니터 : end-point 정보를 k8s에 질의하여 타겟 인지

. 예) serviceMonitor/monitoring/kube-prometheus-stack-apiserver/0 경우 해당 address="192.168.1.53:443" 도달 가능 시 자동 발견됨
* 메트릭을 그래프(Graph)로 조회 : Graph - 아래 PromQL 쿼리(전체 클러스터 노드의 CPU 사용량 합계)입력 후 조회 → Graph 확인
node_cpu_seconds_total
node_cpu_seconds_total{mode="idle"}
(node_cpu_seconds_total{mode="idle"}[1m])

# 노드 메트릭
node 입력 후 자동 출력되는 메트릭 확인 후 선택
node_boot_time_seconds

# kube 메트릭
kube 입력 후 자동 출력되는 메트릭 확인 후 선택
(참고) EKS(Elastic Kubernetes Service)에서는 기본적으로 Prometheus가 kube-controller-manager, etcd, kube-scheduler의 메트릭을 자동으로 수집하지 않음 => 이를 수집하려면 몇 가지 설정을 필요 (https://docs.aws.amazon.com/ko_kr/eks/latest/userguide/view-raw-metrics.html)
. prometheus 수집 규칙 추가
. clusterrole 권한 부여
> Node-exporter
- node-exporter : /proc, /sys 정보 메트릭 엔드포인트 노출

# Table 아래 쿼리 입력 후 Execute 클릭 -> Graph 확인
## 출력되는 메트릭 정보는 node-exporter 를 통해서 노드에서 수집된 정보
node_memory_Active_bytes

# 특정 노드(인스턴스) 필터링 : 아래 IP는 출력되는 자신의 인스턴스 PrivateIP 입력 후 Execute 클릭 -> Graph 확인
node_memory_Active_bytes{instance="192.168.1.105:9100"}

> kube-state-metrics (ksm) : k8s api를 통해 k8s 오브젝트 정보 수집

# replicas's number
kube_deployment_status_replicas
kube_deployment_status_replicas_available
kube_deployment_status_replicas_available{deployment="coredns"}

# scale out
kubectl scale deployment -n kube-system coredns --replicas 3

# 확인
kube_deployment_status_replicas_available{deployment="coredns"}

# scale in
kubectl scale deployment -n kube-system coredns --replicas 1
> kube-proxy : 이미 어플리케이션 내장으로 메트릭 노출 준비 설정 됨
. 프록시 모드별 적절한 메트릭 등록 관리 (iptables, IPVS, NFTables)
. Netfilter 기반 패킷 통계(nfacct) 지원 -> 패킷 드롭, 로컬 트래픽 모니터링 기능 포함

> 어플리케이션 - NGINX 웹서버 어플리케이션 모니터링 설정 및 접속
- ServiceMonitor를 사용하면 수동으로 Prometheus 설정을 수정할 필요 없이, Kubernetes 리소스를 통해 자동으로 모니터링 가능

. nginx 를 helm 설치 시 프로메테우스 익스포터 Exporter 옵션 설정 시 자동으로 nginx 를 프로메테우스 모니터링에 등록
-> 프로메테우스 설정에서 nginx 모니터링 관련 내용을 서비스 모니터 CRD로 추가 가능
. 기존 어플리케이션 Pod에 프로메테우스 모니터링 추가 -> 사이드카 방식의 exporter 컨테이너 추가

> nginx 웹 서버에 metrics 수집 설정 추가 (helm)
. reloader 동작에 의해 설정이 자동으로 반영
# 모니터링
watch -d "kubectl get pod; echo; kubectl get servicemonitors -n monitoring"

# nginx 파드내에 컨테이너 갯수 확인
kubectl describe pod -l app.kubernetes.io/instance=nginx

# 파라미터 파일 생성 : 서비스 모니터 방식으로 nginx 모니터링 대상을 등록하고, export 는 9113 포트 사용
# The chart can deploy ServiceMonitor objects for integration with Prometheus Operator installations. To do so, set the value metrics.serviceMonitor.enabled=true.
cat <<EOT > nginx-values.yaml
metrics:
  enabled: true

  service:
    port: 9113

  serviceMonitor:
    enabled: true
    namespace: monitoring
    interval: 10s
EOT

# 배포
helm upgrade nginx bitnami/nginx --reuse-values -f nginx-values.yaml

# 확인
kubectl get pod,svc,ep
kubectl get servicemonitor -n monitoring nginx
kubectl get servicemonitor -n monitoring nginx -o json | jq
kubectl get servicemonitor -n monitoring nginx -o yaml | kubectl neat

#
kubectl krew install view-secret
kubectl get secret  -n monitoring
kubectl view-secret -n monitoring prometheus-kube-prometheus-stack-prometheus
kubectl view-secret -n monitoring prometheus-kube-prometheus-stack-prometheus | zcat | more
kubectl view-secret -n monitoring prometheus-kube-prometheus-stack-prometheus | zcat | grep nginx -A 20

# [운영서버 EC2] 메트릭 확인 >> 프로메테우스에서 Target 확인
## nginx sub_status url 접속해보기
NGINXIP=$(kubectl get pod -l app.kubernetes.io/instance=nginx -o jsonpath="{.items[0].status.podIP}")
curl -s http://$NGINXIP:9113/metrics # nginx_connections_active Y 값 확인해보기
curl -s http://$NGINXIP:9113/metrics | grep ^nginx_connections_active

# nginx 파드내에 컨테이너 갯수 확인 : metrics 컨테이너 확인
kubectl get pod -l app.kubernetes.io/instance=nginx
kubectl describe pod -l app.kubernetes.io/instance=nginx

# 접속 주소 확인 및 접속
echo -e "Nginx WebServer URL = https://nginx.$MyDomain"
curl -s https://nginx.$MyDomain
kubectl stern deploy/nginx

# 반복 접속
while true; do curl -s https://nginx.$MyDomain -I | head -n 1; date; sleep 1; done


> 쿼리 질의
# nginx scale out : Targets 확인
kubectl scale deployment nginx --replicas 2

# 쿼리 Table -> Graph
nginx_up
sum(nginx_up)

nginx_http_requests_total
nginx_connections_active
> 프로메테우스 메트릭 종류 (4종류)
- 게이지 Gauge : 특정 시점의 값을 표현하기 위해서 사용하는 메트릭 타입, CPU 온도나 메모리 사용량에 대한 현재 시점 값
- 카운터 Counter : 누적된 값을 표현하기 위해 사용하는 메트릭 타입, 증가 시 구간 별로 변화(추세) 확인, 계속 증가 → 함수 등으로 활용
- 서머리 Summary : 구간 내에 있는 메트릭 값의 빈도, 중앙값 등 통계적 메트릭
- 히스토그램 Histogram : 사전에 미리 정의한 구간 내에 있는 메트릭 값의 빈도를 측정 → 함수로 측정 포맷을 변경
> 쿼리 연산자
. Label Matchers : = , ! = , =~ 정규표현식
# 예시
node_memory_Active_bytes
node_memory_Active_bytes{instance="192.168.1.188:9100"}
node_memory_Active_bytes{instance!="192.168.1.188:9100"}

# 정규표현식
node_memory_Active_bytes{instance=~"192.168.+"}
node_memory_Active_bytes{instance=~"192.168.1.+"}

# 다수 대상
node_memory_Active_bytes{instance=~"192.168.1.188:9100|192.168.2.170:9100"}
node_memory_Active_bytes{instance!~"192.168.1.188:9100|192.168.2.170:9100"}

# 여러 조건 AND
kube_deployment_status_replicas_available{namespace="kube-system"}
kube_deployment_status_replicas_available{namespace="kube-system", deployment="coredns"}
. Binary Operators 이진 연산자
- 산술 이진 연산자 : + - * / * ^
- 비교 이진 연산자 : = = ! = > < > = < =
- 논리/집합 이진 연산자 : and 교집합 , or 합집합 , unless 차집합
# 산술 이진 연산자 : + - * / * ^
node_memory_Active_bytes
node_memory_Active_bytes/1024
node_memory_Active_bytes/1024/1024

# 비교 이진 연산자 : = =  ! = > < > = < =
nginx_http_requests_total
nginx_http_requests_total > 100
nginx_http_requests_total > 10000

# 논리/집합 이진 연산자 : and 교집합 , or 합집합 , unless 차집합
kube_pod_status_ready
kube_pod_container_resource_requests

kube_pod_status_ready == 1
kube_pod_container_resource_requests > 1

kube_pod_status_ready == 1 or kube_pod_container_resource_requests > 1
kube_pod_status_ready == 1 and kube_pod_container_resource_requests > 1
. Aggregation Operators 집계 연산자
- sum (calculate sum over dimensions) : 조회된 값들을 모두 더함
- min (select minimum over dimensions) : 조회된 값에서 가장 작은 값을 선택
- max (select maximum over dimensions) : 조회된 값에서 가장 큰 값을 선택
- avg (calculate the average over dimensions) : 조회된 값들의 평균 값을 계산
- group (all values in the resulting vector are 1) : 조회된 값을 모두 ‘1’로 바꿔서 출력
- stddev (calculate population standard deviation over dimensions) : 조회된 값들의 모 표준 편차를 계산
- stdvar (calculate population standard variance over dimensions) : 조회된 값들의 모 표준 분산을 계산
- count (count number of elements in the vector) : 조회된 값들의 갯수를 출력 / 인스턴스 벡터에서만 사용 가능
- count_values (count number of elements with the same value) : 같은 값을 가지는 요소의 갯수를 출력
- bottomk (smallest k elements by sample value) : 조회된 값들 중에 가장 작은 값들 k 개 출력
- topk (largest k elements by sample value) : 조회된 값들 중에 가장 큰 값들 k 개 출력
- quantile (calculate φ-quantile (0 ≤ φ ≤ 1) over dimensions) : 조회된 값들을 사분위로 나눠서 (0 < $ < 1)로 구성하고, $에 해당 하는 요소들을 출력
#
node_memory_Active_bytes

# 출력 값 중 Top 3
topk(3, node_memory_Active_bytes)

# 출력 값 중 하위 3
bottomk(3, node_memory_Active_bytes)
bottomk(3, node_memory_Active_bytes>0)

# node 그룹별: by
node_cpu_seconds_total
node_cpu_seconds_total{mode="user"}
node_cpu_seconds_total{mode="system"}

avg(node_cpu_seconds_total)
avg(node_cpu_seconds_total) by (instance)
avg(node_cpu_seconds_total{mode="user"}) by (instance)
avg(node_cpu_seconds_total{mode="system"}) by (instance)

#
nginx_http_requests_total
sum(nginx_http_requests_total)
sum(nginx_http_requests_total) by (instance)

# 특정 내용 제외하고 출력 : without
nginx_http_requests_total
sum(nginx_http_requests_total) without (instance)
sum(nginx_http_requests_total) without (instance,container,endpoint,job,namespace)
. 시계열 Selector - time series selector : 시점, 구간 벡터, offset, @ 등
- 인스턴스 벡터 Instant Vector : 시점에 대한 메트릭 값만을 가지는 데이터 타입
- 레인지 벡터 Range Vector : 시간의 구간을 가지는 데이터 타입
- 시간 단위 : ms, s, m(주로 분 사용), h, d, w, y
# 시점 데이터
node_cpu_seconds_total

# 15초 마다 수집하니 아래는 지난 4회차/8회차의 값 출력
node_cpu_seconds_total[1m]
node_cpu_seconds_total[2m]

# 서비스 정보 >> 네임스페이스별 >> cluster_ip 별
kube_service_info
count(kube_service_info)
count(kube_service_info) by (namespace)
count(kube_service_info) by (cluster_ip)

# 컨테이너가 사용 메모리 -> 파드별
container_memory_working_set_bytes
sum(container_memory_working_set_bytes)
sum(container_memory_working_set_bytes) by (pod)
topk(5,sum(container_memory_working_set_bytes) by (pod))
topk(5,sum(container_memory_working_set_bytes) by (pod))/1024/1024
7. 그라파나 Grafana
- 로그, 메트릭, 트레이스 등 TSDB 데이터를 시각화하고 알림, 질의 할 수 있도록 하는 오픈 소스
- 데이터 저장을 하지 않음
- 접속 정보 확인 및 로그인 : 기본 계정 - admin / prom-operator
# 그라파나 버전 확인
kubectl exec -it -n monitoring sts/kube-prometheus-stack-grafana -- grafana cli --version
grafana cli version 11.5.1

# ingress 확인
kubectl get ingress -n monitoring kube-prometheus-stack-grafana
kubectl describe ingress -n monitoring kube-prometheus-stack-grafana

# ingress 도메인으로 웹 접속 : 기본 계정 - admin / prom-operator
echo -e "Grafana Web URL = https://grafana.$MyDomain"

- Search dashboards : 대시보드 검색
- Starred : 즐겨찾기 대시보드
- Dashboards : 대시보드 전체 목록 확인
- Explore : 쿼리 언어 PromQL를 이용해 메트릭 정보를 그래프 형태로 탐색
- Alerting : 경고, 에러 발생 시 사용자에게 경고를 전달
- Connections : 설정, 예) 데이터 소스 설정 등
- Administartor : 사용자, 조직, 플러그인 등 설정
> Connections → Your connections : 스택의 경우 자동으로 프로메테우스를 데이터 소스로 추가해둠 ← 서비스 주소 확인

# 서비스 주소 확인
kubectl get svc,ep -n monitoring kube-prometheus-stack-prometheus
NAME                                       TYPE        CLUSTER-IP     EXTERNAL-IP   PORT(S)    AGE
service/kube-prometheus-stack-prometheus   ClusterIP   10.100.143.5   <none>        9090/TCP   21m

NAME                                         ENDPOINTS           AGE
endpoints/kube-prometheus-stack-prometheus   192.168.2.93:9090   21m
# 테스트용 파드 배포
cat <<EOF | kubectl create -f -
apiVersion: v1
kind: Pod
metadata:
name: netshoot-pod
spec:
containers:
- name: netshoot-pod
image: nicolaka/netshoot
command: ["tail"]
args: ["-f", "/dev/null"]
terminationGracePeriodSeconds: 0
EOF
kubectl get pod netshoot-pod
# 접속 확인
kubectl exec -it netshoot-pod -- nslookup kube-prometheus-stack-prometheus.monitoring
kubectl exec -it netshoot-pod -- curl -s kube-prometheus-stack-prometheus.monitoring:9090/graph -v ; echo
# 삭제
kubectl delete pod netshoot-pod
> 대시보드 사용 : 기본 대시보드와 공식 대시보드 가져오기
- 기본 대시보드
. 스택을 통해 기본 설치되는 대시보드
. 자원 사용량 - cluster, pod, 노드 등

- 공식 대시보드
- [Kubernetes / Views / Global] Dashboard → New → Import → 15757 력입력 후 Load ⇒ 데이터소스(Prometheus 선택) 후 Import 클릭

- [Kubernetes All-in-one Cluster Monitoring KR] Dashboard → New → Import → 17900 입력 후 Load ⇒ 데이터소스(Prometheus 선택) 후 Import 클릭

* CPU 점유율 / 메모리 점유율 / 디스크 사용률 출력되도록 하기
- 해당 패널에서 Edit → 아래 수정 쿼리 입력 후 Run queries 클릭 → 상단 Save 후 Apply
# 수정 : CPU 점유율
sum by (**instance**) (irate(node_cpu_seconds_total{mode!~"guest.*|idle|iowait", **instance**="$**instance**"}[5m]))

# 수정 : 메모리 점유율
(node_memory_MemTotal_bytes{instance="$instance"}-node_memory_MemAvailable_bytes{instance="$instance"})/node_memory_MemTotal_bytes{instance="$instance"}

# 수정 : 디스크 사용률
sum(node_filesystem_size_bytes{instance="$instance"} - node_filesystem_avail_bytes{instance="$instance"}) by (instance) / sum(node_filesystem_size_bytes{instance="$instance"}) by (instance)


> 네임스페이스, Pod 이름 별 필터값 보이게 하기
- namespace 경우 : kube_pod_info 로 수정

- namespace 오른쪽 Showing usages for 클릭 시 → 맨 하단에 pod variable 가 namespace 를 하위 관계 확인


> Pod 리소스 limt 표기 하기
- CPU
# 기존
sum(kube_pod_container_resource_limits_cpu_cores{pod="$pod"})

# 변경 전 쿼리 시도
kube_pod_container_resource_limits_cpu_cores
kube_pod_container_resource_limits
kube_pod_container_resource_limits{resource="cpu"}

# 변경
sum(kube_pod_container_resource_limits{resource="cpu", pod="$pod"})
- MEMORY
# 기존
sum(kube_pod_container_resource_limits_memory_bytes{pod="$pod"})

# 변경
sum(kube_pod_container_resource_limits{resource="memory", pod="$pod"})
> 그 밖에 대시보드
더보기
- [Node Exporter Full] Dashboard → New → Import → 1860 입력 후 Load ⇒ 데이터소스(Prometheus 선택) 후 Import 클릭
- [Node Exporter for Prometheus Dashboard based on 11074] 15172
- kube-state-metrics-v2 가져와보자 : Dashboard ID copied! (13332) 클릭 - 링크
- [kube-state-metrics-v2] Dashboard → New → Import → 13332 입력 후 Load ⇒ 데이터소스(Prometheus 선택) 후 Import 클릭
- [Amazon EKS] AWS CNI Metrics 16032
==>
# PodMonitor 배포
cat <<EOF | kubectl create -f -
apiVersion: monitoring.coreos.com/v1
kind: PodMonitor
metadata:
  name: aws-cni-metrics
  namespace: kube-system
spec:
  jobLabel: k8s-app
  namespaceSelector:
    matchNames:
    - kube-system
  podMetricsEndpoints:
  - interval: 30s
    path: /metrics
    port: metrics
  selector:
    matchLabels:
      k8s-app: aws-node
EOF

# PodMonitor 확인
kubectl get podmonitor -n kube-system
> NGINX Application 대시보드
- 그라파나에 12708 대시보드 추가
=> 2개에서 9개로 증가
# scale out
kubectl scale deployment nginx --replicas 9

> Panel 패널 만들기 [ https://grafana.com/docs/grafana/latest/panels-visualizations/visualizations/ ]
더보기
- Graphs & charts
- Time series is the default and main Graph visualization.
- State timeline for state changes over time.
- Status history for periodic state over time.
- Bar chart shows any categorical data.
- Histogram calculates and shows value distribution in a bar chart.
- Heatmap visualizes data in two dimensions, used typically for the magnitude of a phenomenon.
- Pie chart is typically used where proportionality is important.
- Candlestick is typically for financial data where the focus is price/data movement.
- Gauge is the traditional rounded visual showing how far a single metric is from a threshold.
- Stats & numbers
- Misc
- Table is the main and only table visualization.
- Logs is the main visualization for logs.
- Node graph for directed graphs or networks.
- Traces is the main visualization for traces.
- Flame graph is the main visualization for profiling.
- Canvas allows you to explicitly place elements within static and dynamic layouts.
- Geomap helps you visualize geospatial data.
- Widgets
- Dashboard list can list dashboards.
- Alert list can list alerts.
- Text can show markdown and html.
- News can show RSS feeds.
> 실습 준비 : 신규 대시보스 생성 → 패널 생성(Code 로 변경) → 쿼리 입력 후 Run queries 클릭 후 오른쪽 상단 Apply 클릭 → 대시보드 상단 저장
- Time series : 아래 쿼리 입력 후 오른쪽 입력 → Title(노드별 5분간 CPU 사용 변화율)
node_cpu_seconds_total
rate(node_cpu_seconds_total[5m])
sum(rate(node_cpu_seconds_total[5m]))
sum(rate(node_cpu_seconds_total[5m])) by (instance)
- Bar chart : Add → Visualization 오른쪽(Bar chart) ⇒ 쿼리 Options : Legend(Auto), Format(Table), Type(Instance) → Title(네임스페이스 별 디플로이먼트 갯수)
kube_deployment_status_replicas_available
count(kube_deployment_status_replicas_available) by (namespace)
- Stat : Add → Visualization 오른쪽(Stat) → Title(nginx 파드 수)
kube_deployment_spec_replicas
kube_deployment_spec_replicas{deployment="nginx"}

# scale out
kubectl scale deployment nginx --replicas 6
- Gauge : Add → Visualization 오른쪽(Gauge) → Title(노드 별 1분간 CPU 사용률)
node_cpu_seconds_total
node_cpu_seconds_total{mode="idle"}
node_cpu_seconds_total{mode="idle"}[1m]
rate(node_cpu_seconds_total{mode="idle"}[1m])
avg(rate(node_cpu_seconds_total{mode="idle"}[1m])) by (instance)
1 - (avg(rate(node_cpu_seconds_total{mode="idle"}[1m])) by (instance))
- Table : Add → Visualization 오른쪽(Table) ⇒ 쿼리 Options : Format(Table), Type(Instance) → Title(노드 OS 정보)
. Transform data → Organize fields by name : id_like, instance, name, pretty_name
node_os_info
> Variable 적용해보기

8. 그라파나 얼럿 Alert
- 설정한 Alert rule에 따라 알림을 보낼 수 있음
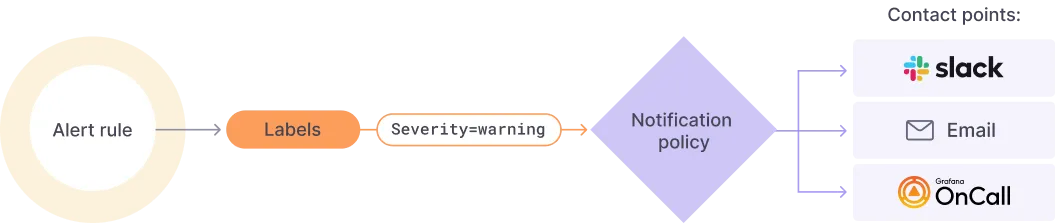
- Contact points → Add contact point 클릭
- Integration : 슬랙
- Webhook URL : webhook 주소 입력
- Optional Slack settings → Username : 메시지 구분을 위해서 각자 자신의 닉네임 입력
- 오른쪽 상단 : Test 해보고 저장

2. Notification policies : 기본 정책 수정 Edit - Default contact point(slack)

3. 그라파나 → Alerting → Alert ruels → Create alert rule : Name(nginx alert) - nginx 웹 요청 1분 동안 누적 60 이상 시 Alert 설정

. 아래 Folder 과 Evaluation group(1m), Pending period(1m) 은 +Add new 클릭 후 신규로 만들어 주자

. Configure notifications : Contack point(slack) => Save and exit!
4. nginx 반복 접속 실행 후 슬랙 채널 알람 확인
while true; do curl -s https://nginx.$MyDomain -I | head -n 1; date; done
9. OpenTelemetry (OTel)
- OpenTelemetry는 트레이스, 메트릭, 로그를 통합하여 모니터링하는 표준 프레임워크
- 벤더 중립적인 방식으로 Prometheus, Jaeger, Grafana 같은 모니터링 도구와 함께 사용하면 정교한 분산 추적 및 성능 모니터링이 가능
주요 개념
- 원격 측정(Observability):
- 트레이스: 시스템에서 요청 또는 트랜잭션 관련 활동을 추적
- 메트릭: 시스템 성능 지표 수집 (예: CPU 사용량, 요청 수)
- 로그: 애플리케이션 이벤트 기록
- Signals:
- Traces: 요청 흐름을 추적하는 정보
- Metrics: 시스템 성능을 수치로 표현
- Logs: 시스템에서 발생한 이벤트 기록
- Baggage: 여러 스팬에 전달되어 공유되는 값 (예: HTTP 헤더에 위치)
- Instrumentation:
- Zero-code: 코드 수정 없이 자동 계측
- Code-based: 코드 수정 후 계측
- Libraries: 미리 제공된 라이브러리를 사용하여 계측
분산 추적 소개
- 클라우드 네이티브 애플리케이션은 여러 애플리케이션을 통해 분산 처리되며, 이로 인해 요청 흐름을 추적하는 것이 어려움
- 상관관계 ID (correlation ID)를 사용하여 여러 서비스 간의 트랜잭션을 추적
- 각 요청마다 생성되어 다른 서비스로 전파, 이를 통해 특정 트랜잭션에 대한 모든 로그 메시지를 추적

분산 추적의 3가지 핵심 요소
- Trace: 요청 또는 트랜잭션과 관련된 활동 - Trace ID로 식별
- Span: 요청 처리의 각 단계 - Start/End 타임스탬프와 함께 Span ID로 식별
- Tag: Span에 대한 추가 메타데이터 - 요청 URI나 사용자 정보 등을 제공
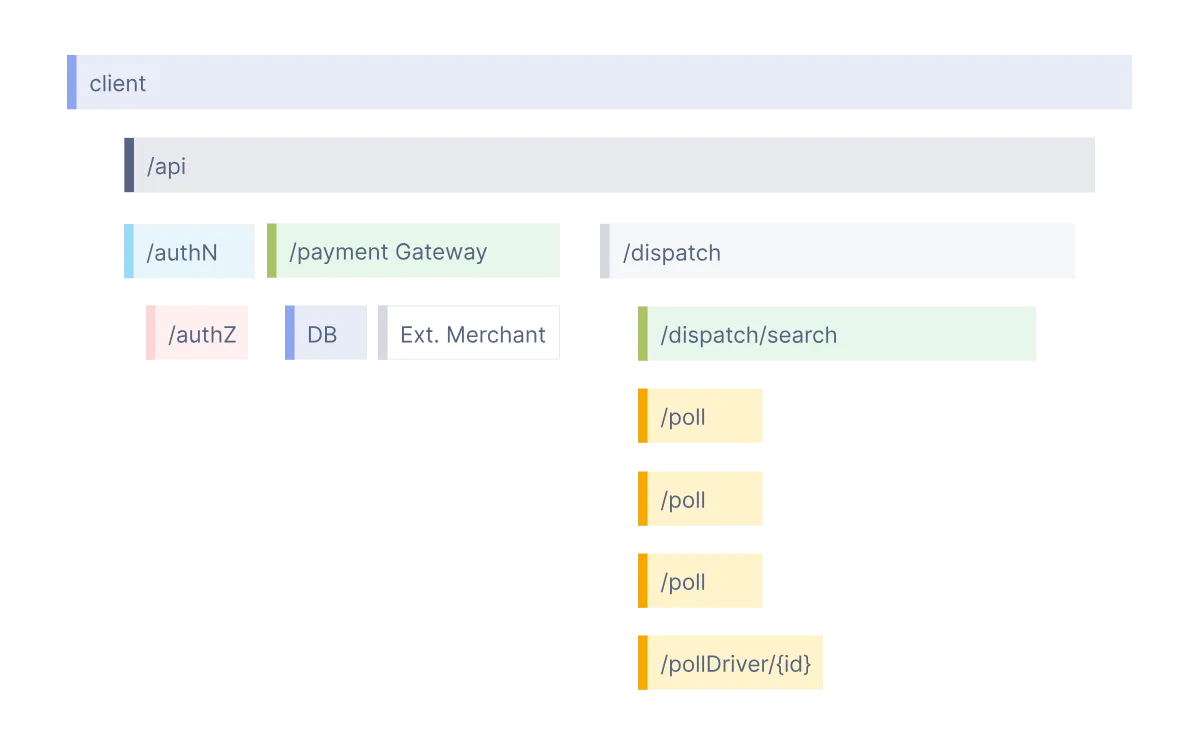
'K8S - EKS' 카테고리의 다른 글
| 7주차 - EKS Mode/Nodes (0) | 2025.03.22 |
|---|---|
| 6주차 - EKS Security (0) | 2025.03.15 |
| 5주차 - EKS Autoscaling (0) | 2025.03.07 |
| 3주차 - EKS Storage, Managed Node Groups (1) | 2025.02.22 |
| 2주차 - EKS Networking (0) | 2025.02.14 |


